
Animated Weather Radar Tutorial for Non-Technical Users
Last updated: 2023-09-10
If you're looking to dive into the world of animated weather radar, you're in the right place. This tutorial will guide you through the basics, making it perfect for non-technical users. For those needing specialized features or integration into complex analyses, other solutions may be a better fit.
Summary
- Understand the fundamentals of how weather radar works.
- Learn how to read animated radar visualizations for precipitation tracking.
- Find out the essential components of Doppler radar technology.
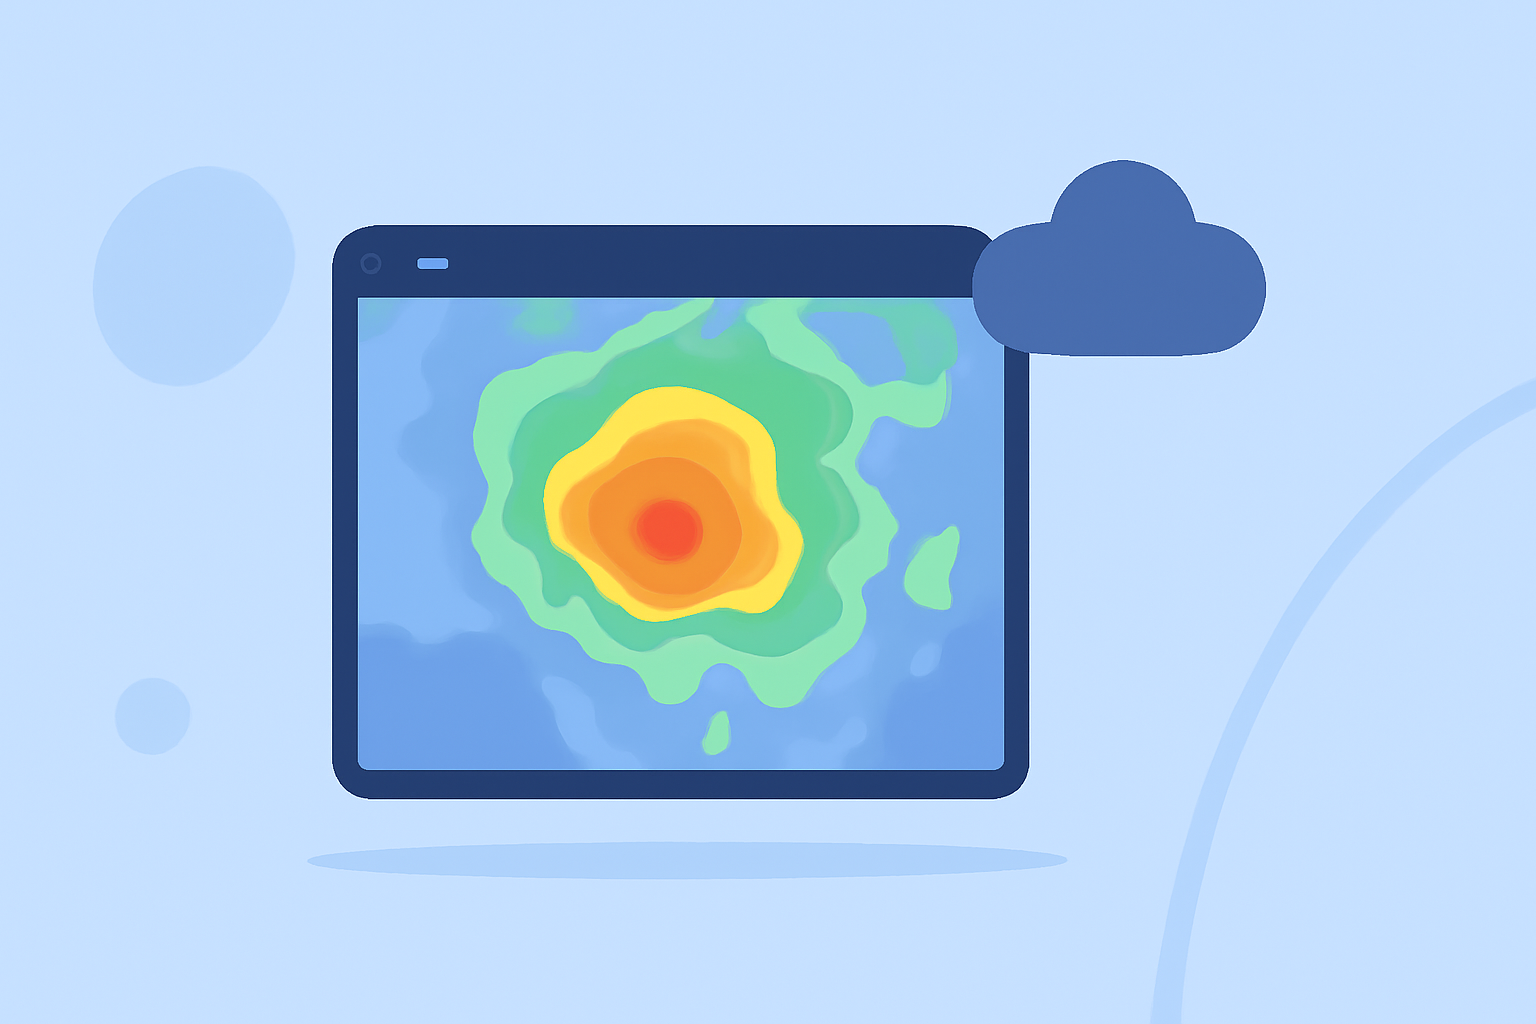
- Get familiar with interpreting radar data through color-coded maps.
What is Weather Radar and How Does It Work?
Weather radar is essentially a system that detects rain, snow, and other meteorological phenomena by sending radio waves and analyzing signals that bounce back from precipitation particles. A radar system typically consists of a transmitter that sends out signals and a receiver that collects the reflected energy. This technology allows us to visualize storm movement and intensity, crucial for forecasting and alerting.
In the U.S., the Weather Surveillance Radar (WSR-88D) network comprises numerous stations that complete volume scans by rotating at specific elevation angles. This comprehensive overview allows meteorologists to generate critical weather updates quickly.
Understanding Doppler Radar
Doppler radar is a powerful tool that not only shows precipitation but also wind patterns. It works based on the Doppler effect, where the frequency of the returned signals changes depending on the speed of the moving object (like raindrops). Doppler radar systems can detect both the intensity of precipitation and its direction—information vital for severe weather warnings.
For users of Clime, the animated visualization of radar data adds a rich, dynamic element, allowing you to watch how storms develop and move over time, enhancing situational awareness.
How to Read Animated Weather Radar
Animated radar loops represent the movement of precipitation over time, creating an intuitive way to understand weather patterns. Here’s how to interpret these visuals:
- Color-Coded Reflectivity: Radar displays often use a color spectrum to represent precipitation intensity. Lighter colors generally indicate lighter rain, while darker shades signify heavier precipitation.
- Movement Over Time: By watching an animated loop, you can clearly see how rainfall moves, whether it's approaching your location or dissipating. This can be particularly useful for planning outdoor activities or making travel decisions.
- Alerts and Warnings: Many radar systems provide overlay alerts for severe weather, like storms or hurricanes. Familiarizing yourself with alert icons and their meanings can help you respond quickly in the event of severe conditions.
Benefits of Using Animated Radar in Your Weather Checks
Animated radar offers multiple advantages:
- Real-Time Insights: You receive near-instant updates on weather conditions—critical for planning and safety.
- Versatile Applications: From casual checking to more serious storm tracking, understanding radar enhances your ability to prepare.
- Easy to Use: Clime's user-friendly interface makes accessing and interpreting animated radar straightforward, even for first-time users.
Conclusion: What We Recommend
For those eager to learn about animated weather radar:
- Start with the basics of how weather radar functions.
- Utilize resources like Clime, where you can visually navigate through animated radar and receive up-to-date alerts.
- Keep an eye out for color-coded maps to enhance your understanding of precipitation intensity.
Overall, understanding animated weather radar can enrich your daily planning and safety measures. With tools like Clime making the complex simple, you're well-equipped to tackle any weather-related surprises!