
Avoiding Common Mistakes in Composite Reflectivity Maps
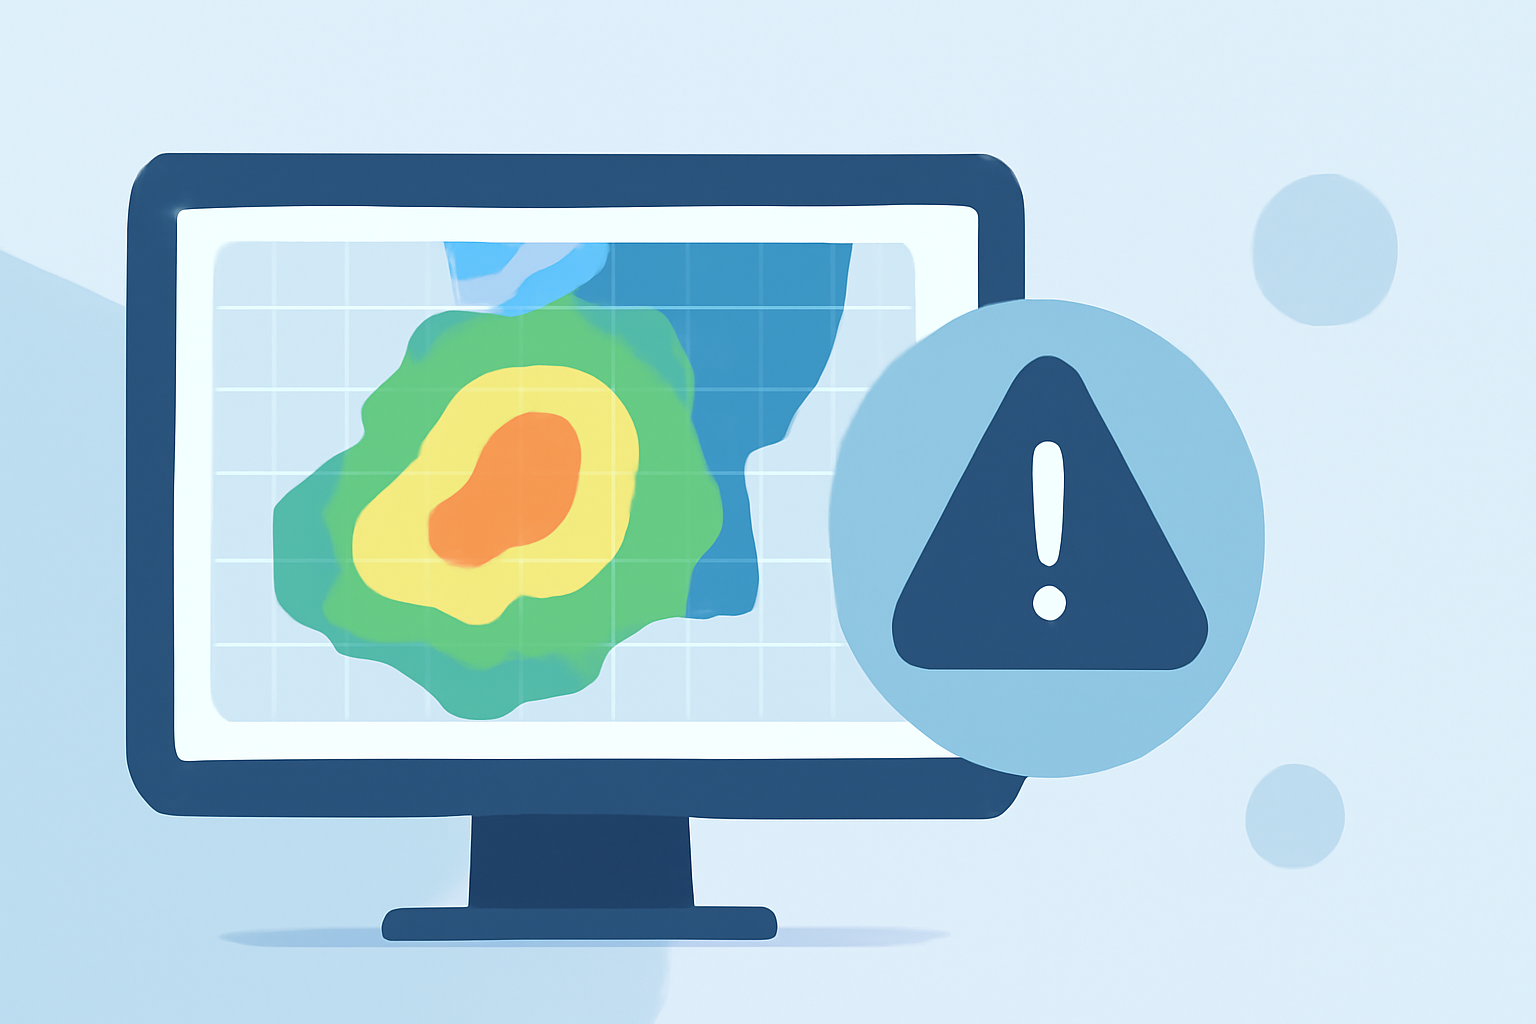
Composite reflectivity maps are essential tools in meteorology, providing a comprehensive view of precipitation intensity by displaying the highest reflectivity values from various radar angles. However, misinterpretations can lead to inaccurate weather assessments. To ensure precise analysis, it's crucial to be aware of common mistakes and how to avoid them.
1. Misinterpreting Precipitation Reach
Composite reflectivity shows the maximum reflectivity within a vertical column but doesn't indicate whether precipitation reaches the ground. High reflectivity values at elevated levels may suggest virga—precipitation that evaporates before reaching the surface. To determine if precipitation is reaching the ground, consider the storm's vertical structure and environmental conditions. (weather.gov)
2. Overlooking Bright Band Contamination
The bright band phenomenon occurs when melting snowflakes cause an anomalously high reflectivity layer above the ground. This can lead to overestimations of precipitation intensity near the surface. Be aware that composite reflectivity may not remove bright band contamination, potentially affecting the accuracy of precipitation estimates. (vlab.noaa.gov)
3. Ignoring Vertical Structure of Storms
Relying solely on composite reflectivity without considering the storm's vertical profile can be misleading. For instance, strong updrafts can saturate higher levels of a thunderstorm, forming an overhang region that may not be evident in the composite reflectivity. Always analyze the storm's vertical structure to assess the potential for severe weather accurately. (en.wikipedia.org)
4. Misunderstanding Data Resolution and Quality
Composite reflectivity products vary in spatial and temporal resolution. Low-resolution data may not capture fine-scale features, while high-resolution data can be more susceptible to noise. Additionally, non-meteorological echoes like ground clutter or interference can affect data quality. Ensure you're using the appropriate resolution and that the data has been quality-controlled to remove such artifacts. (vlab.noaa.gov)
5. Relying Solely on Composite Reflectivity for Severe Weather Detection
While composite reflectivity is valuable for identifying areas of intense precipitation, it may not detect certain severe weather features like hook echoes associated with tornadoes. Incorporate other radar products and observational data to obtain a comprehensive understanding of severe weather threats. (windy.com)
Best Practices for Accurate Interpretation
-
Integrate Multiple Data Sources: Combine composite reflectivity with other radar products, satellite imagery, and surface observations to enhance situational awareness.
-
Understand Data Limitations: Be aware of the strengths and limitations of composite reflectivity, especially regarding vertical resolution and potential contamination.
-
Stay Updated: Regularly consult training materials and updates from authoritative sources to keep abreast of best practices in radar data interpretation.
By recognizing these common pitfalls and adhering to best practices, meteorologists can improve the accuracy of their weather analyses and forecasts.
Highlights:
- Composite Reflectivity - Warning Decision Training Division (WDTD) - Virtual Lab
- Windy: Weather Radar: The Science Behind the Colorful Images We See Practically Every Day
- Interpretation of composite reflectivity, Published on Thursday, May 28