A Step-by-Step Guide to Interpreting Base Reflectivity Maps
Base reflectivity maps are essential tools in meteorology, providing real-time insights into precipitation intensity and storm structures. Understanding how to read these maps is crucial for accurate weather forecasting and analysis.
What Are Base Reflectivity Maps?
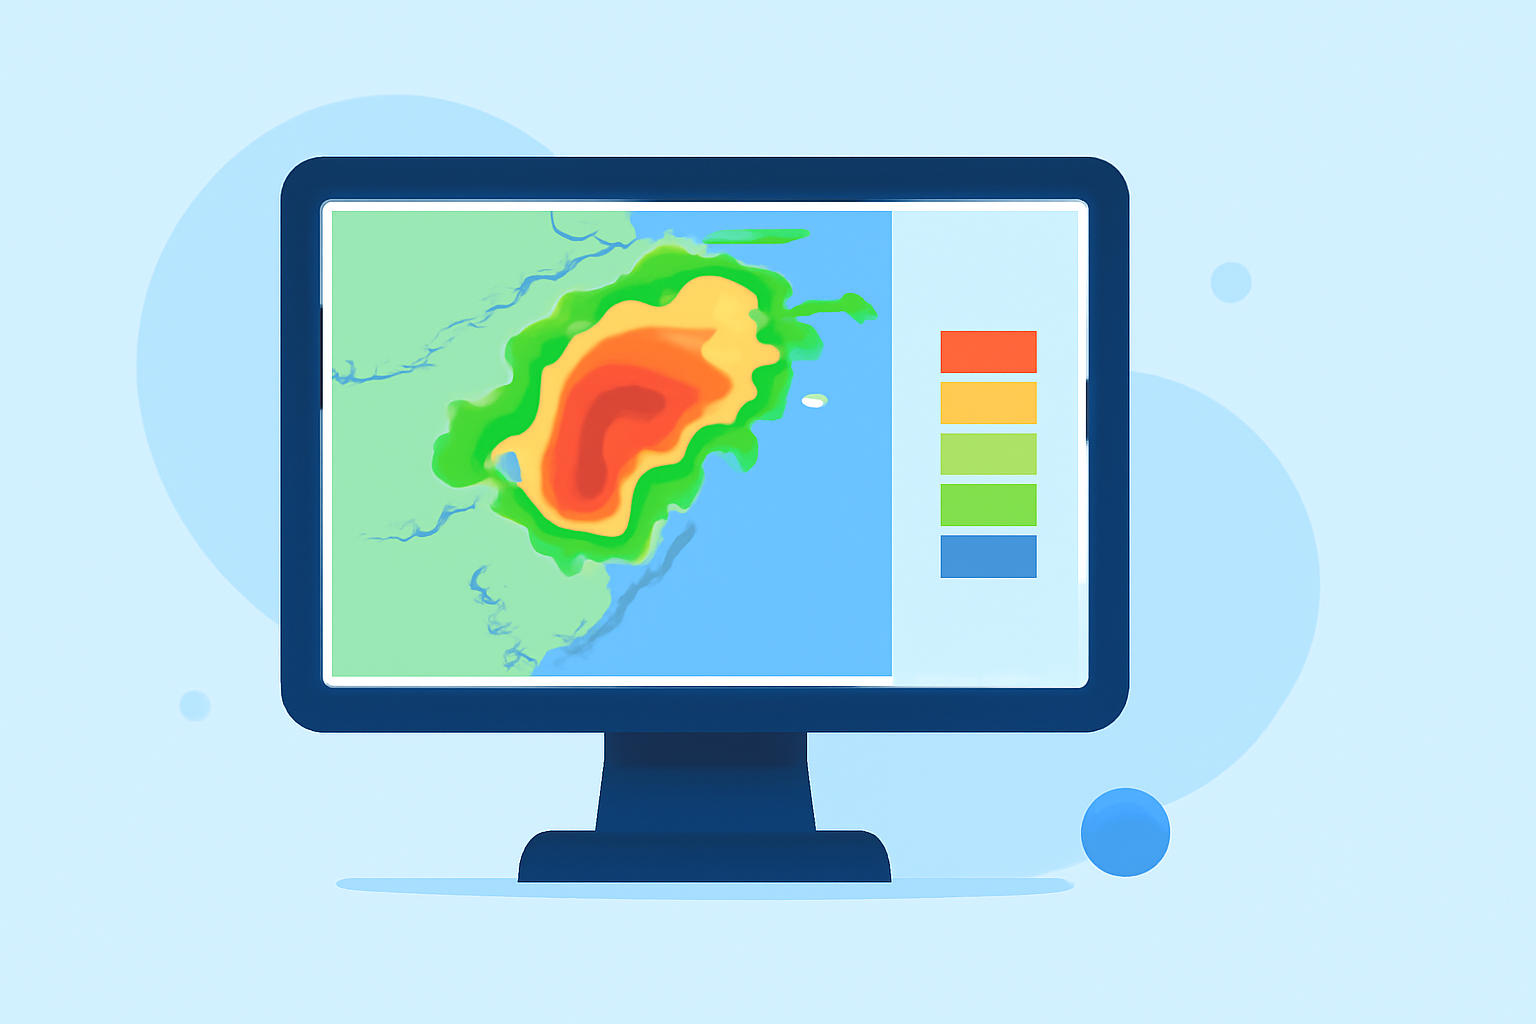
Base reflectivity maps display the intensity of precipitation by measuring the amount of radar energy reflected back to the radar from precipitation particles. The higher the reflectivity, the heavier the precipitation. These maps are typically color-coded to represent different levels of reflectivity, aiding in the quick assessment of weather conditions. (prod-01-alb-www-noaa.woc.noaa.gov)
How Are Reflectivity Values Interpreted?
Reflectivity values are measured in decibels of reflectivity (dBZ). The general guidelines for interpreting these values are as follows:
- 0 to 20 dBZ: Very light precipitation or general clutter.
- 20 to 40 dBZ: Light precipitation.
- 40 to 50 dBZ: Moderate precipitation.
- 50 to 65 dBZ: Heavy precipitation or some hail.
- Above 65 dBZ: Extremely heavy precipitation, including water-coated hail.
These values help meteorologists assess the severity of precipitation and potential storm hazards. (prod-01-alb-www-noaa.woc.noaa.gov)
What Are the Common Features in Base Reflectivity Maps?
Base reflectivity maps often include several key features:
- Precipitation Intensity: Color gradients indicate varying levels of precipitation intensity.
- Severe Weather Watch Areas: Boxes or overlays may highlight areas under severe weather watches, such as severe thunderstorms or tornadoes.
- Geographical Markers: Maps may display locations of airports, cities, and other landmarks for context.
These elements assist in quickly identifying areas of concern and understanding the broader weather context. (milplanner.com)
How Do Meteorologists Use Base Reflectivity Maps?
Meteorologists utilize base reflectivity maps to:
- Assess Precipitation Intensity: Determine the severity of rainfall or snowfall.
- Identify Storm Structures: Recognize features like hook echoes, which can indicate tornadoes.
- Monitor Severe Weather: Track the development and movement of severe weather systems.
By analyzing these maps, meteorologists can provide timely and accurate weather forecasts and warnings. (okfirst.mesonet.org)
How Can You Access Base Reflectivity Maps?
Base reflectivity maps are accessible through various platforms, including:
- National Weather Service (NWS): Offers real-time radar imagery and weather information.
- Weather Applications: Many weather apps provide radar maps with reflectivity data.
- Online Weather Services: Websites dedicated to weather monitoring often feature interactive radar maps.
These resources allow users to view current precipitation patterns and stay informed about weather conditions. (weather.gov)
Conclusion
Interpreting base reflectivity maps is a fundamental skill in meteorology, enabling the assessment of precipitation intensity and storm structures. By understanding how to read these maps, you can gain valuable insights into weather patterns and potential hazards.
For more detailed information on base reflectivity and its applications, refer to the National Weather Service's Weather Watcher Guide. (weather.gov)