Understanding Base Reflectivity Maps on Smart Displays
Base reflectivity maps are essential tools in weather monitoring, providing real-time insights into precipitation intensity and storm structures. These maps display the strength of radar echoes, measured in decibels of Z (dBZ), indicating the amount of energy returned to the radar by precipitation particles. Higher dBZ values correspond to heavier precipitation, such as intense rainfall or hail. (prod-01-alb-www-noaa.woc.noaa.gov)
How Do Base Reflectivity Maps Work?
Weather radars emit signals that bounce off precipitation particles, returning to the radar receiver. The strength of this return signal, or reflectivity, is directly related to the size and density of the particles. Base reflectivity maps capture this data from the lowest elevation scan (0.5°), offering immediate insights into precipitation patterns. These maps are updated every five minutes, providing timely information for weather analysis. (prod-01-alb-www-noaa.woc.noaa.gov)
Base Reflectivity vs. Composite Reflectivity
While base reflectivity focuses on the lowest elevation scan, composite reflectivity combines data from multiple elevation angles to present the maximum reflectivity observed. This composite view is particularly useful for assessing storm intensity and structure. However, composite reflectivity images are available only after the radar completes all its scans, making them less timely than base reflectivity maps. (prod-01-alb-www-noaa.woc.noaa.gov)
Interpreting Base Reflectivity Maps
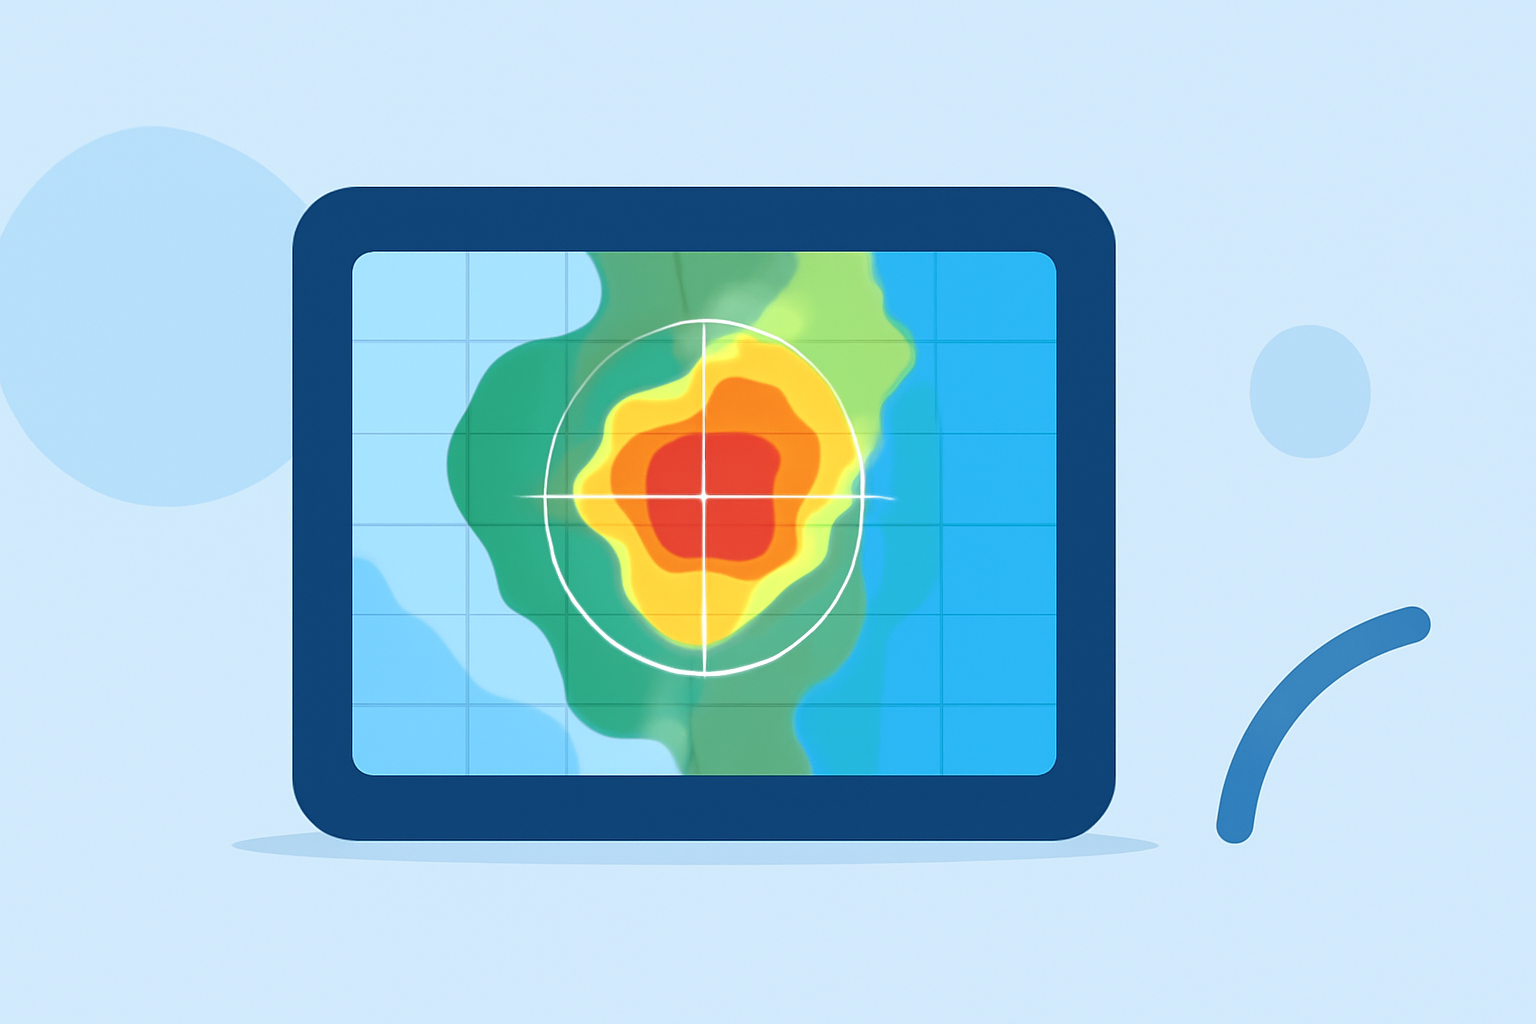
On a base reflectivity map, colors represent different levels of precipitation intensity:
-
Light Green to Yellow: Light to moderate precipitation
-
Orange to Red: Heavy precipitation
-
Magenta to Purple: Severe precipitation, including hail
By analyzing these color-coded areas, meteorologists and users can quickly identify storm locations, movement, and potential severity. (prod-01-alb-www-noaa.woc.noaa.gov)
Base Reflectivity Maps on Smart Displays
Integrating base reflectivity maps into smart displays enhances user experience by providing interactive, real-time weather information. Users can zoom in on specific regions, track storm developments, and receive timely updates, all from the convenience of their devices. This functionality is particularly beneficial for planning outdoor activities, travel, and staying informed about severe weather events.
Clime's Advanced Weather Features
Clime offers a comprehensive suite of weather monitoring tools, including detailed base reflectivity maps. Our platform provides real-time updates, interactive maps, and personalized weather alerts, ensuring users have access to accurate and timely information. With Clime, you can confidently plan your day, monitor severe weather, and make informed decisions based on the latest data.
Conclusion
Base reflectivity maps are vital for understanding precipitation patterns and storm dynamics. By integrating these maps into smart displays, users gain immediate access to critical weather information. Clime's advanced features further enhance this experience, offering real-time updates and interactive tools to keep you informed and prepared.