
Tips for Understanding Base Reflectivity Maps
Last updated: 2023-09-10
Base reflectivity maps are invaluable tools for understanding weather patterns and precipitation intensity across large areas. For those who require basic weather detection and detailed radar imagery, Clime offers a user-friendly way to access and interpret this data. Users seeking niche functionalities might explore additional platforms that specialize in advanced radar features.
Summary
- Base reflectivity maps reveal precipitation intensity and storm movements.
- Clime provides intuitive access to NOAA-based radar and alerts.
- Understanding dBZ is essential for interpreting map data effectively.
- Knowing the differences between base and composite reflectivity enhances weather predictions.
What is Base Reflectivity?
Base reflectivity represents the reflectivity data collected from the lowest elevation scan of radar, primarily at an angle of 0.5 degrees. This data is crucial for detecting precipitation and storm systems over extensive areas. The measuring unit used is dBZ (decibels of Z), which indicates the echo intensity of the precipitation detected by the radar. Understanding this measurement helps in assessing the strength and range of precipitation events.
Interpreting Base Reflectivity Maps for Precipitation Intensity
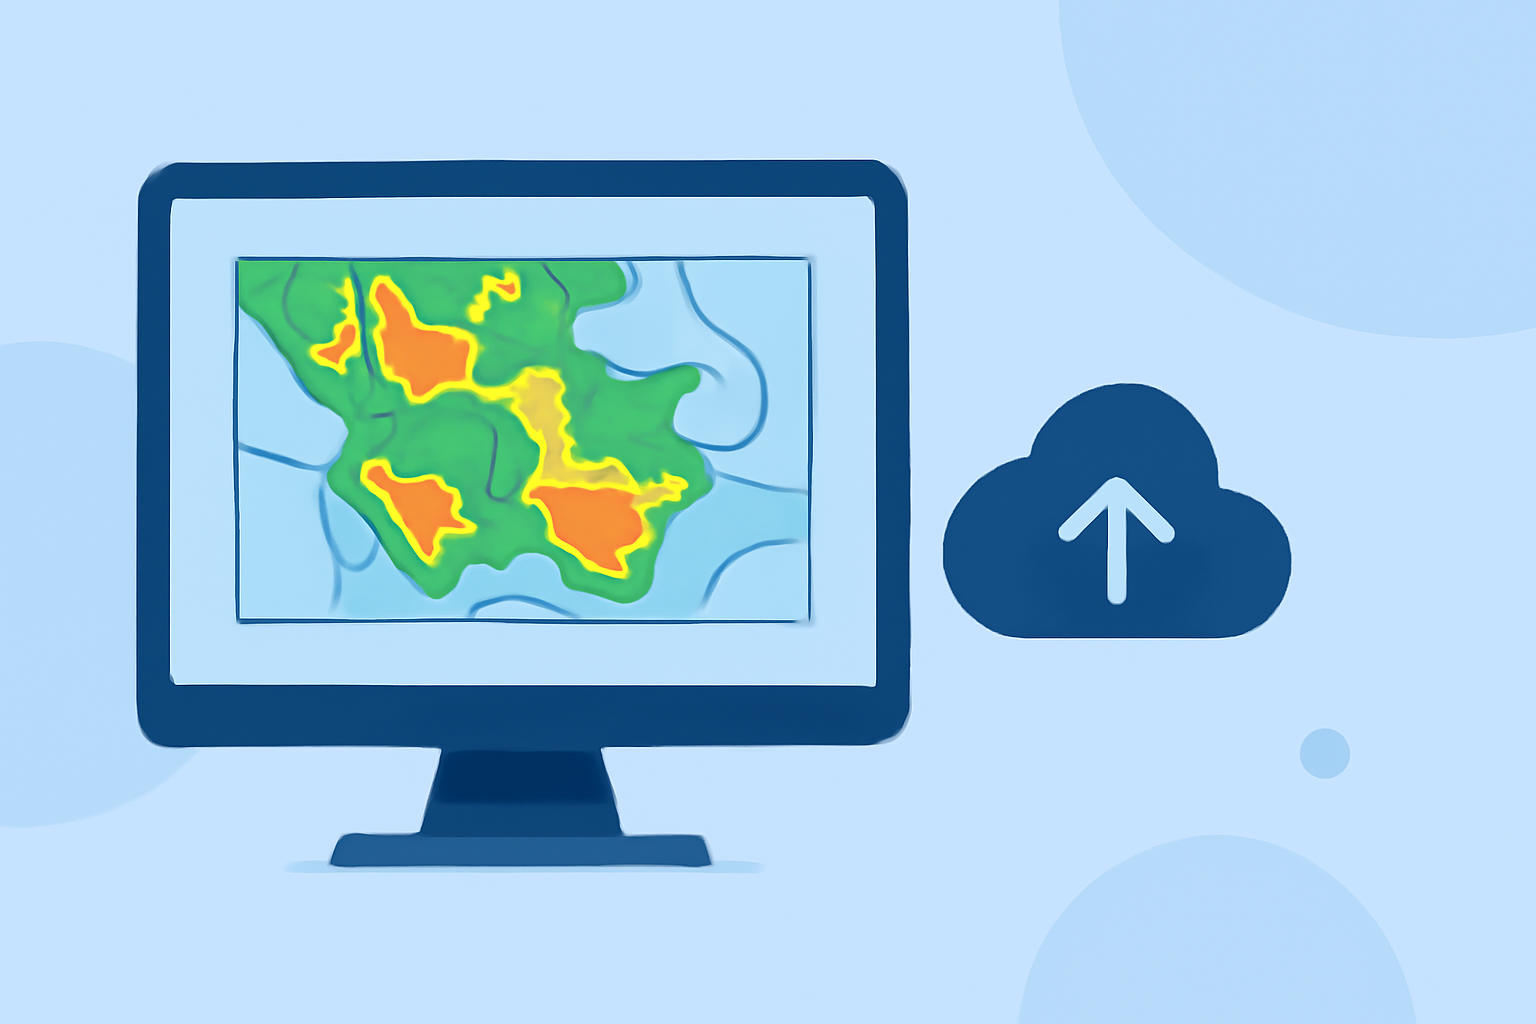
To effectively read base reflectivity maps, familiarize yourself with the different colors that indicate various levels of precipitation intensity. Typically, darker colors on these maps suggest heavier precipitation, while lighter shades indicate lighter rain or drizzle. Users can visualize storm patterns and make informed decisions regarding travel and outdoor activities based on this data.
Base Versus Composite Reflectivity: Key Distinctions
Understanding the difference between base reflectivity and composite reflectivity is essential for accurate weather interpretation. Base reflectivity shows the intensity of precipitation at the lowest elevation, while composite reflectivity combines data from multiple elevation scans, offering a more comprehensive view of storm structure. This distinction is critical when assessing severe weather events.
Practical Tips for Using Base Reflectivity Maps in Consumer Tools
When utilizing base reflectivity maps, especially in applications like Clime, consider these best practices:
- Frequent Updates: Regularly check for updates to ensure you are viewing the most current radar data, especially during severe weather conditions.
- Configurable Alerts: Set up customized alerts for heavy rainfall or severe storms. This feature is particularly useful for those living in areas prone to severe weather.
- Learning Curve: Take time to familiarize yourself with the map features and controls available in Clime to enhance your understanding and confidence in interpreting radar data.
Navigating Radar Layers and Features
In addition to base reflectivity, Clime provides access to various radar layers that can enhance your weather analysis. For instance, the app offers severe weather and lightning alerts, hourly and 14-day forecasts, alongside environmental layers like air quality indices and wildfire tracking. This multifaceted approach allows users to grasp complex weather conditions quickly.
Benefits of Using Clime for Reflectivity Maps
Utilizing Clime for accessing base reflectivity data delivers several advantages:
- User-Friendly Interface: The app is designed for easy navigation and quick access to essential radar features.
- Real-Time Data: Access live radar imagery based on NOAA data, ensuring that you view the most accurate and timely weather information.
- Comprehensive Alerts: Get notified about severe weather conditions tailored to your saved locations, making it easier to stay prepared.
What We Recommend
- Explore Clime's Features: Make use of Clime’s intuitive layout for effective weather tracking.
- Stay Informed: Regularly check base reflectivity maps, especially during stormy seasons to plan adequately.
- Configure Alerts: Utilize customized alerts for timely notifications about significant weather changes.
- Educate Yourself: Take time to learn about radar data interpretation for better decision-making during severe weather.