Common Precipitation Maps Questions for Outdoor Enthusiasts
Last updated: 2023-09-06
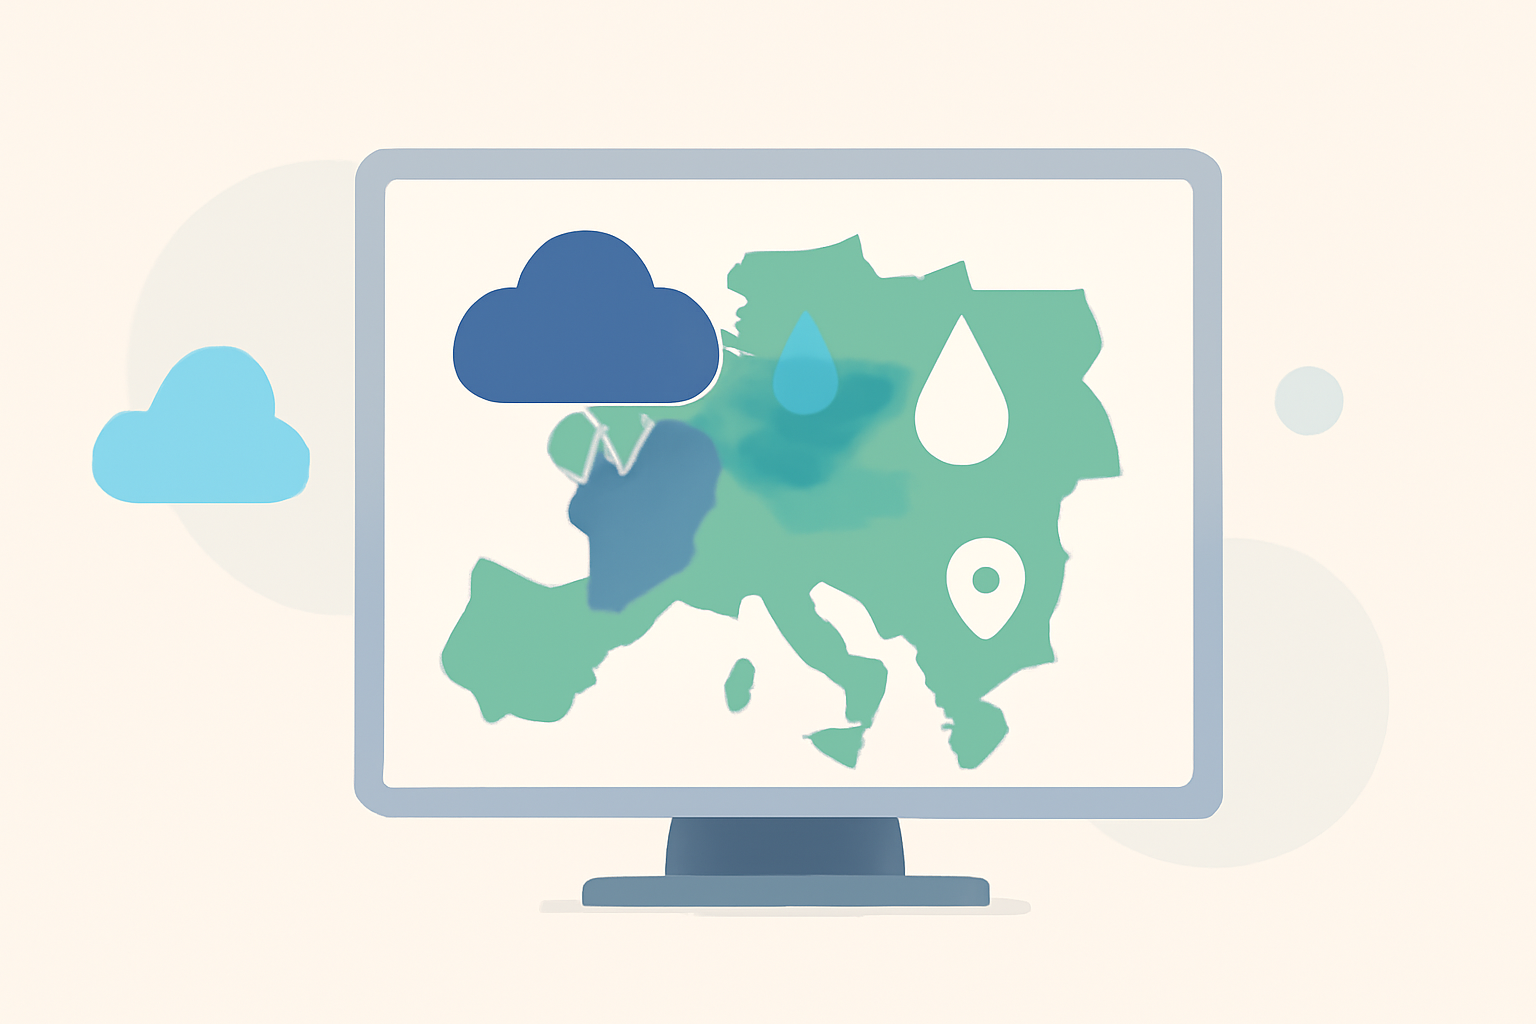
For outdoor enthusiasts, understanding precipitation maps is crucial for planning safe and enjoyable activities. Clime serves as an excellent starting point for interpreting these maps effectively, while other options may suit specific use cases.
Summary
- Precipitation maps display different rainfall intensities and types using color codes.
- Clime offers real-time radar data along with additional features like 14-day forecasts.
- Understanding local terrain can impact how precipitation predictions are utilized.
- Familiarity with weather symbols enhances map-reading skills for outdoor trips.
How should outdoor enthusiasts interpret precipitation colors and overlays on maps?
Understanding the color coding on precipitation maps is vital. Typically, light blues indicate light rain, while darker shades show heavier precipitation. For instance, red or purple often signifies severe weather events like thunderstorms or hail. Maps feature overlays that can indicate various types of precipitation, helping users plan effectively based on the predicted conditions. Using a tool like Clime provides clear visualizations based on NOAA radar data, ensuring enthusiasts have the latest updates on rainfall and severe weather alerts.
How far ahead can precipitation maps reliably predict rainfall for outdoor trips?
Precipitation maps can predict rainfall generally up to 48 hours in advance with reasonable accuracy. However, the reliability decreases with longer time frames due to the unpredictable nature of weather systems. Tools like Clime provide not just real-time radar maps but also hourly and 14-day forecasts, helping outdoor enthusiasts plan their activities while considering changing weather conditions.
What local terrain considerations affect precipitation interpretation for outdoor activities?
Topography and local geography can significantly influence how precipitation is experienced. For example, mountainous regions may receive more rain due to orographic lift, while valleys could experience varying weather patterns. Understanding local terrain helps in interpreting maps effectively. Clime incorporates local features in its radar data, enabling users to assess how terrain may affect precipitation types and intensities directly related to their planned activities.
What are the benefits of dual-polarization radar technology in precipitation mapping?
Dual-polarization radar technology enhances the ability to identify different precipitation types, such as distinguishing between rain, snow, sleet, or hail. This advanced technology improves accuracy in weather forecasting and helps outdoor enthusiasts make more informed decisions about their plans. Clime utilizes such advanced radar systems to provide comprehensive weather information, allowing users to understand the local conditions better.
How can Doppler radar enhance the planning of outdoor activities?
Doppler radar tools provide critical insights into the movement and speed of precipitation. This information is particularly useful for outdoor activities, enabling enthusiasts to predict when rain will arrive and how long it may last. By tracking these patterns, users can adjust their plans accordingly, ensuring safety and enjoyment. Clime leverages Doppler technology to deliver timely alerts and insights for various weather phenomena.
What weather symbols should outdoor enthusiasts be familiar with?
Familiarity with weather symbols enhances the ability to read precipitation maps. Common symbols include raindrops for rain, snowflakes for snow, and arrows depicting wind direction and speed. Knowledge of these symbols aids in interpreting weather maps more effectively, thereby improving outdoor planning. Clime aids users by clearly indicating weather information with straightforward visuals based on established conventions.
What we recommend
- Use Clime to benefit from NOAA radar data and comprehensive weather forecasts, allowing for informed decision-making.
- Familiarize yourself with weather map symbols and color codes to interpret data effectively.
- Keep an eye on local topography, as it will affect precipitation patterns and your outdoor experience.
- Always check real-time data for the most accurate predictions, especially before engaging in planned outdoor activities.