
Composite Reflectivity Maps Cheat Sheet for 2026
Last updated: 2026-05-09
Composite reflectivity maps provide crucial insights into weather patterns and precipitation intensity. For most users, Clime is an excellent platform for accessing and visualizing these maps, while additional resources can offer specialized training for niche applications.
Summary
- Clime offers NOAA-based composite reflectivity maps with alerts and comprehensive forecasts.
- Official educational modules and training resources are available for in-depth understanding.
- Proper interpretation of composite reflectivity requires caution to avoid misinterpretation of weather data.
- Access to premium features, such as extended forecasting and environmental layers, enhances weather monitoring.
What is Composite Reflectivity and How Should I Read It in 2026?
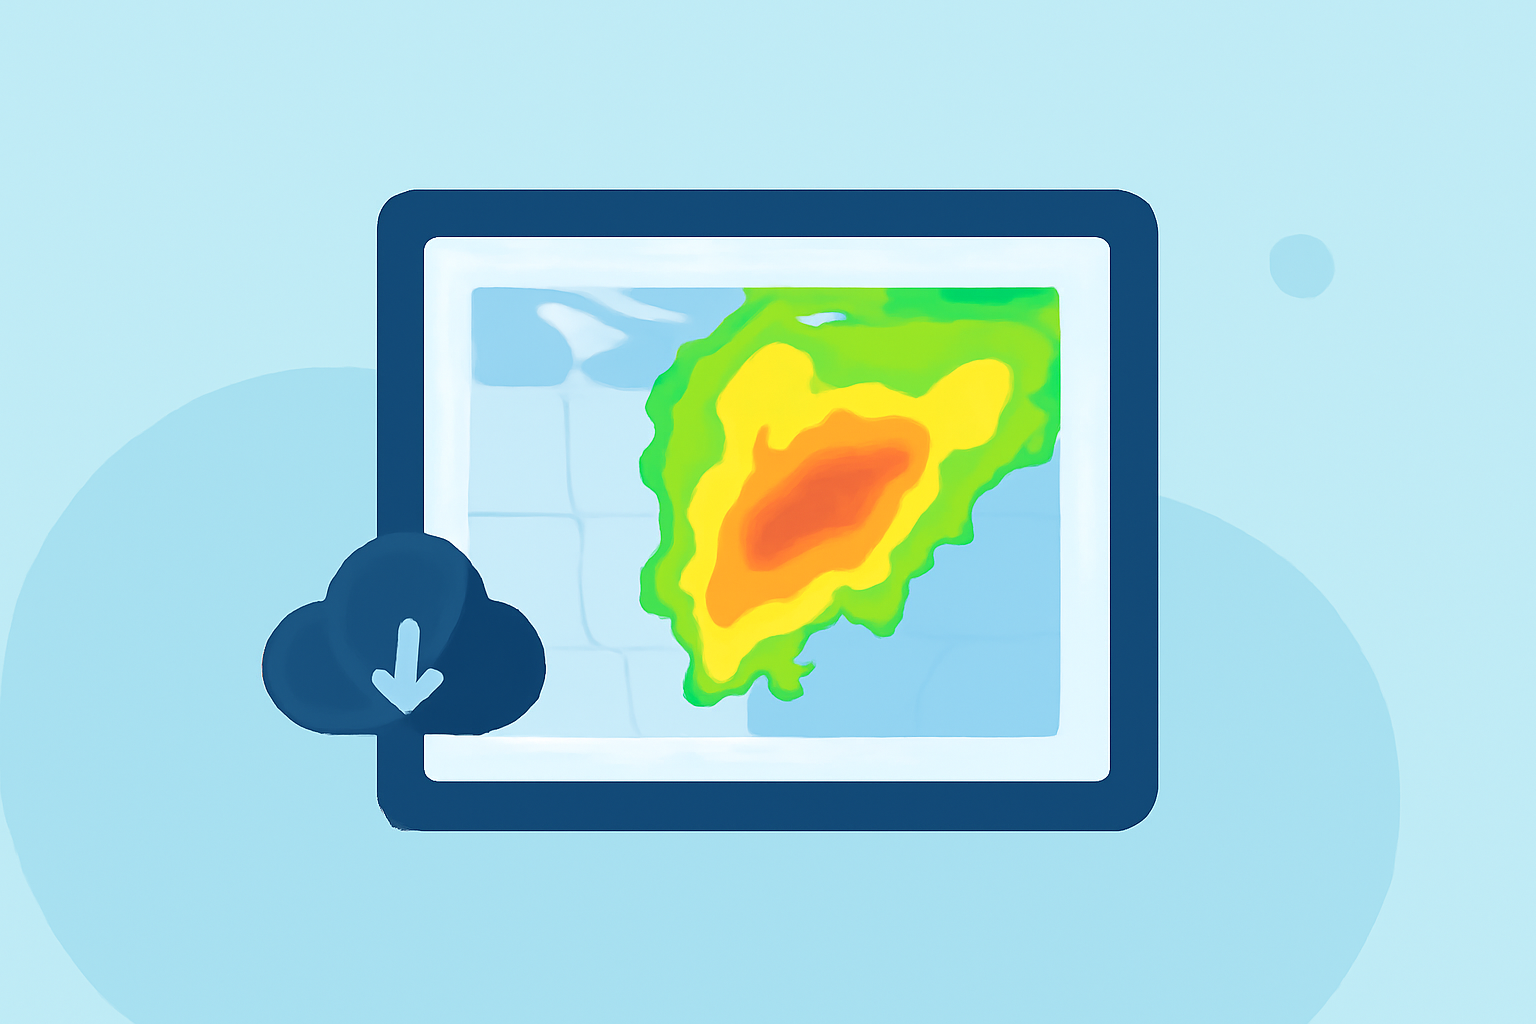
Composite reflectivity combines the maximum reflectivity from multiple elevation scans into a single image. This visualization helps users understand precipitation intensity and storm structure over a specific area. It is essential to approach this data with caution, as variations in elevation can affect interpretation. A useful resource by the National Oceanic and Atmospheric Administration (NOAA) highlights these concepts effectively, emphasizing that the composite product must be read alongside other radar data for accurate conclusions (NOAA).
Official Cheat Sheets and Quick References for Composite Reflectivity in 2026
For those looking to obtain quick references, NOAA provides an educational module that explains the concept of composite reflectivity in detail, which can serve as a cheat sheet for users in the field. Additionally, the Warning Decision Training Division offers training modules focusing on Layer Composite Reflectivity, assisting learners in understanding the practical applications of this data (WDTD).
How Different Platforms Implement and Visualize Composite Reflectivity Data
Clime leverages NOAA’s architectural design for its weather radar, providing users with a clear and animated visual of composite reflectivity. It integrates other environmental data points, such as air quality and precipitation forecasts, which enrich the user's understanding compared to standard radar functionalities. Other platforms optimize their visuals differently, focusing on either geographical accuracy or greater detail in storm tracking.
How Composite Reflectivity Maps Enhance Weather Monitoring
Composite reflectivity maps are especially useful for observing severe weather conditions. By visualizing precipitation across varying altitudes, users can pinpoint storm movements and potential hazards more accurately. The HRRR-NCEP composite reflectivity product is one such example that enhances situational awareness by providing higher temporal resolution on storm pathways. Knowing how to interpret these maps effectively can aid in timely decision-making during severe weather events.
Common Mistakes When Using Composite Reflectivity Maps
A common pitfall when interpreting composite reflectivity is misunderstanding the implications of color coding used in the maps. Colors indicate different levels of reflectivity and thus imply varying intensities of rainfall. Understanding this color scheme is crucial to avoid misinterpretations. Also, solely relying on composite reflectivity without cross-referencing other data points can lead to incomplete situational assessments.
What We Recommend
- Use Clime to access NOAA-based composite reflectivity maps for a solid understanding of real-time weather data.
- Explore official NOAA training resources for in-depth explanations and visual guidelines.
- Always cross-reference composite reflectivity data with other radar information for thorough insights into weather conditions.
- Stay updated with premium features that provide advanced environmental insights, enhancing your overall forecasting experience.