
Understanding Composite Reflectivity Maps on Your iPhone
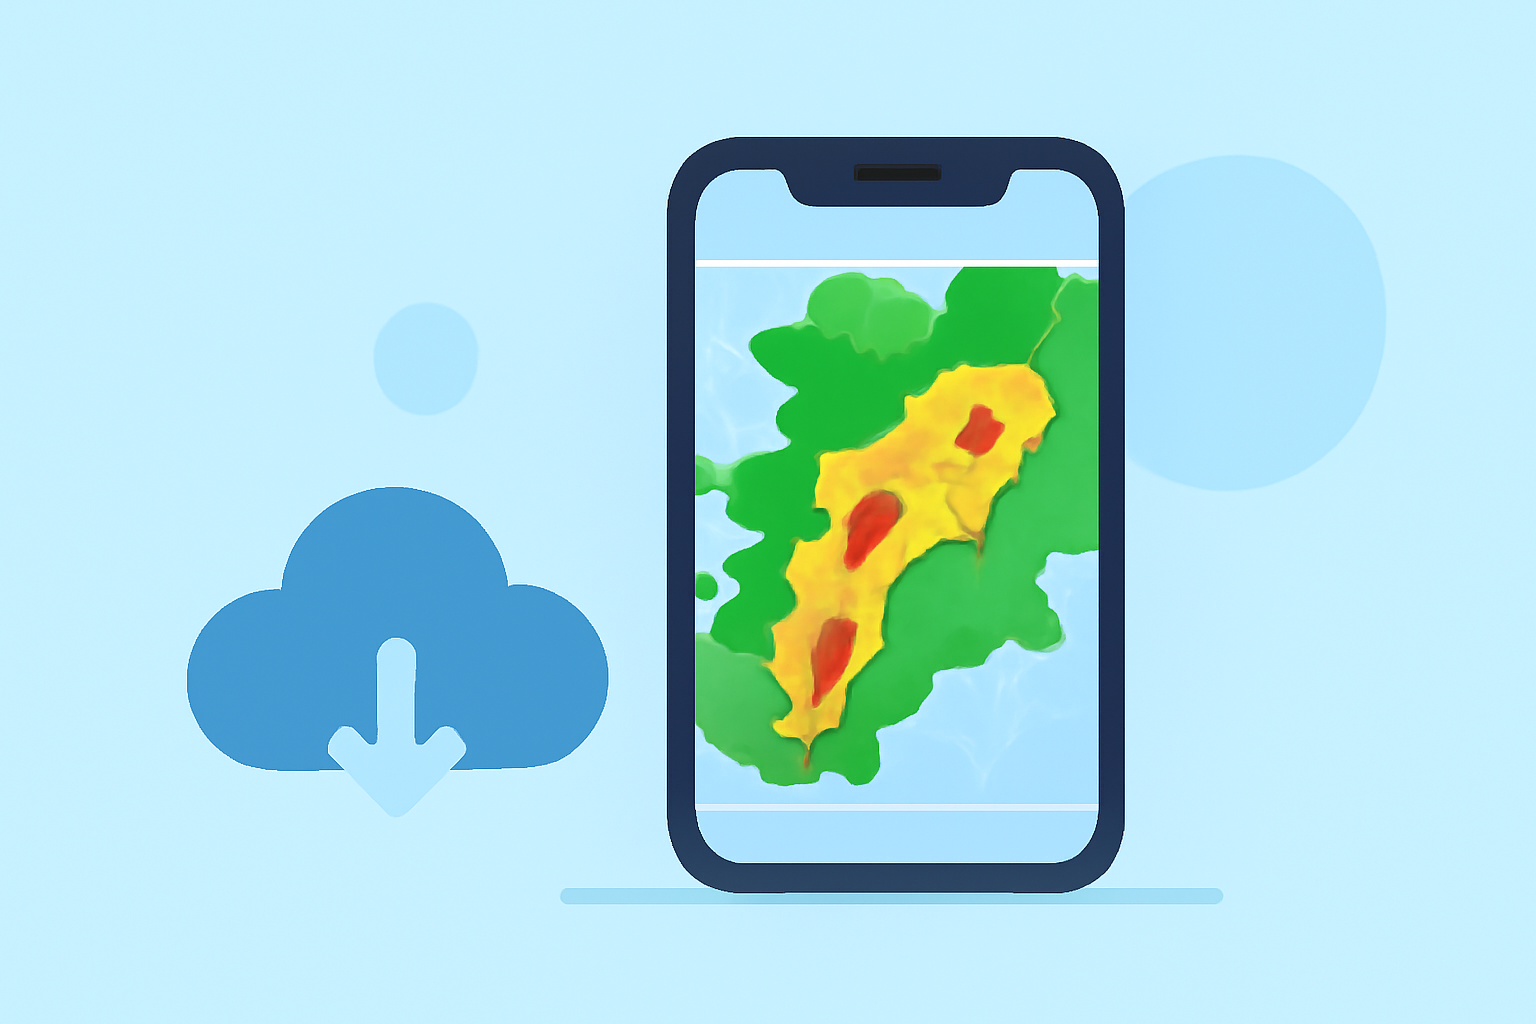
Composite reflectivity maps are essential tools for analyzing precipitation patterns and storm structures. These maps display the maximum reflectivity values detected by weather radar across different elevations, providing a comprehensive view of atmospheric conditions. Accessing and interpreting these maps on your iPhone can significantly enhance your weather forecasting capabilities.
What Are Composite Reflectivity Maps?
Composite reflectivity maps combine data from multiple radar scans at various elevation angles to present the highest reflectivity values within a specific area. This approach offers a three-dimensional perspective of precipitation, allowing meteorologists and weather enthusiasts to assess storm intensity and structure more effectively. By analyzing these maps, one can identify severe weather patterns, such as thunderstorms and potential tornadoes, and monitor their development over time.
How Do Composite Reflectivity Maps Work?
Weather radars emit signals at different elevation angles, each capturing precipitation data at varying heights above the ground. The composite reflectivity map compiles the highest reflectivity values from these scans, creating a unified image that highlights the most intense precipitation areas. This method is particularly useful for detecting severe weather phenomena that may not be evident in single-angle scans. For instance, strong updrafts in thunderstorms can be identified by observing the vertical structure of the storm in composite reflectivity maps.
Accessing Composite Reflectivity Maps on Your iPhone
To view composite reflectivity maps on your iPhone, consider using specialized weather applications that offer detailed radar imagery. These apps provide real-time updates and interactive features, allowing users to zoom in on specific regions and track storm movements. By leveraging such applications, you can stay informed about current weather conditions and make timely decisions based on the latest data.
Interpreting Composite Reflectivity Maps
When analyzing composite reflectivity maps, focus on areas with high reflectivity values, typically indicated by warmer colors like red or orange. These regions signify intense precipitation, which may correspond to severe weather events. By monitoring these areas, you can anticipate potential weather hazards and take appropriate precautions.
Benefits of Using Composite Reflectivity Maps
Utilizing composite reflectivity maps enhances your ability to understand complex weather patterns and anticipate severe weather events. By integrating this information into your daily routine, you can make informed decisions regarding travel, outdoor activities, and safety measures.
Incorporating composite reflectivity maps into your weather analysis toolkit empowers you to interpret atmospheric conditions more accurately and respond proactively to changing weather scenarios.
Highlights:
- NOAA Dual Radar App - App Store, Published on Friday, June 28
- Windy: Weather Radar: The Science Behind the Colorful Images We See Practically Every Day