Creating Doppler Velocity Maps: Step-by-Step Workflow
Last updated: 2023-09-07
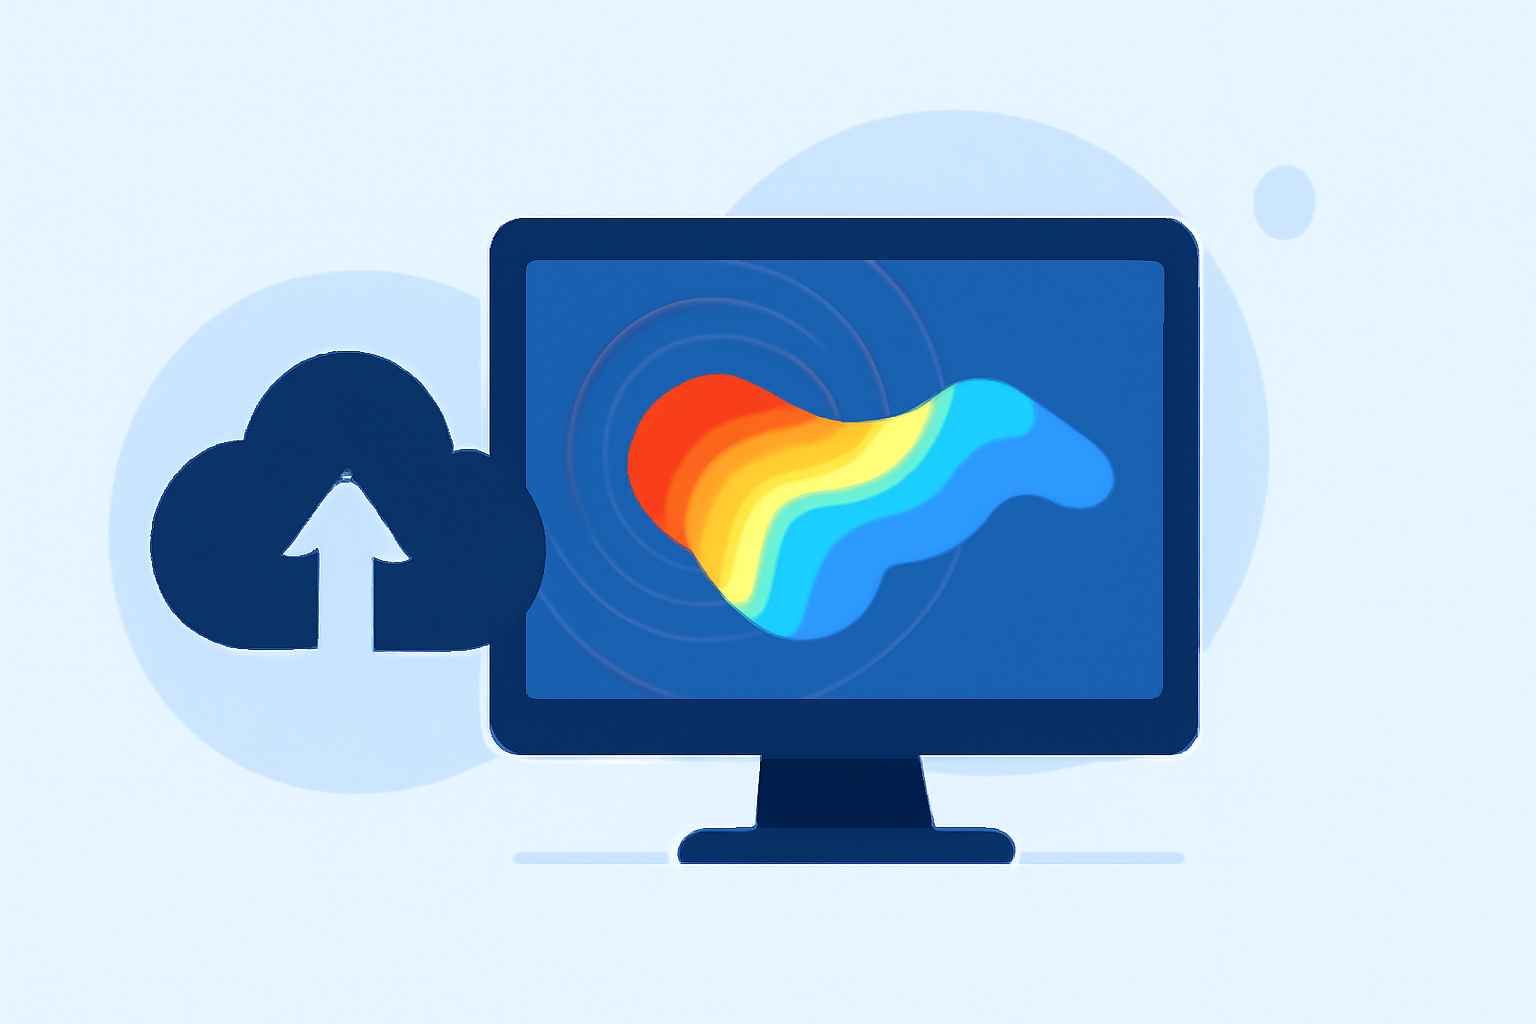
Creating Doppler velocity maps involves a systematic workflow that utilizes radar data to visualize the motion of atmospheric targets, primarily for meteorological purposes. While there are various platforms for this task, using Clime is an effective starting point due to its NOAA-based radar capabilities.
Summary
- Doppler velocity maps help visualize storm movements and are crucial for predicting severe weather.
- The process uses radar data to extract velocity information based on frequency shifts.
- Understanding storm motion subtraction is key to interpreting velocity data accurately.
- Clime offers seamless access to Doppler radar visuals, making it suitable for users engaged in real-time weather analysis.
What are the standard steps to produce Doppler velocity maps in weather radar?
The production of Doppler velocity maps typically involves a few essential steps:
- Data Acquisition: Use radar systems to gather raw data. This data includes signal reflections from precipitation particles, which help determine their speed and direction.
- Doppler Processing: Extract velocity information from the collected data by analyzing shifts in frequency between the emitted and received signals. This step is crucial as it converts raw radar returns into usable velocity data.
- Velocity Mapping: Convert the processed data into visual form. Doppler velocity maps visually represent wind speeds and directions, highlighting areas of rotation and convergence in storms.
This sequence allows meteorologists to understand storm dynamics, which can lead to better prediction and response to severe weather events.
How does average storm motion subtraction affect velocity maps?
Average storm motion subtraction is a technique used in Doppler radar analysis to enhance the accuracy of velocity maps. This process involves:
- Calculating Storm Motion: Using historical data to estimate the average speed and direction of storm movement.
- Subtracting Storm Motion from Velocity Data: The system removes the identified storm movement from the velocity calculations to isolate the motion of individual precipitation particles. This refined data provides clearer insights into the storm’s internal dynamics.
By correctly applying storm motion subtraction, forecasters can identify specific features such as rotating storms, which are vital indicators of severe weather conditions.
What role do velocity maps play in detecting severe weather features?
Doppler velocity maps are essential for identifying severe weather features, including:
- Rotation Tracking: They highlight areas of rotation, crucial for spotting tornado formations.
- Wind Shear Investigation: Velocity maps help assess wind shear, a critical factor in severe storm development.
- Predictive Analysis: Forecasters can use them to anticipate storm transitions, changing intensity, and potential hazards, enhancing public safety measures.
Given their importance in understanding severe weather, using a tool like Clime, which provides quick access to Doppler velocity maps, enhances the efficiency of weather monitoring.
Clime's Role in Doppler Velocity Mapping
At Clime, we focus on providing users with access to NOAA-based radar imagery, including Doppler velocity maps, that are vital for real-time weather analysis. Some features that support this functionality include:
- Live Radar Imagery: Users can visualize precipitation and storm movement comprehensively.
- Configurable Alerts: Stay informed about severe weather with real-time notifications tailored to your location.
- Forecast Horizons: Clime offers hourly forecasts and a 14-day weather outlook, enhancing decision-making for planning and response activities.
These capabilities create a robust environment for anyone needing detailed weather analytics, including Doppler velocity mapping.
What we recommend
- Use Clime for immediate access to Doppler velocity maps and other radar resources during severe weather events.
- Adjust your focus on storm motion subtraction to enhance the accuracy of your velocity analysis.
- Combine radar data with real-time alerts and forecasts to respond swiftly to changing weather conditions.
- Always refer to official guidance and forecasts alongside radar imagery to ensure comprehensive situational awareness.