
A Step-by-Step Guide to Doppler Shear Maps
Last updated: 2023-09-16
To create Doppler shear maps effectively, start with the Doppler radar interface on Clime, which provides visual layers and tools for analysis. If you need more advanced metrics, consider specialized tools dedicated to radar analytics.
Summary
- Clime offers a user-friendly platform for creating and interpreting Doppler shear maps.
- Essential for understanding severe weather patterns and tracking storms.
- Doppler shear maps help visualize atmospheric rotation and wind shear, crucial for predicting severe weather events.
- Though advanced features exist in specialized tools, Clime provides an accessible starting point for most users.
What Are Doppler Shear Maps?
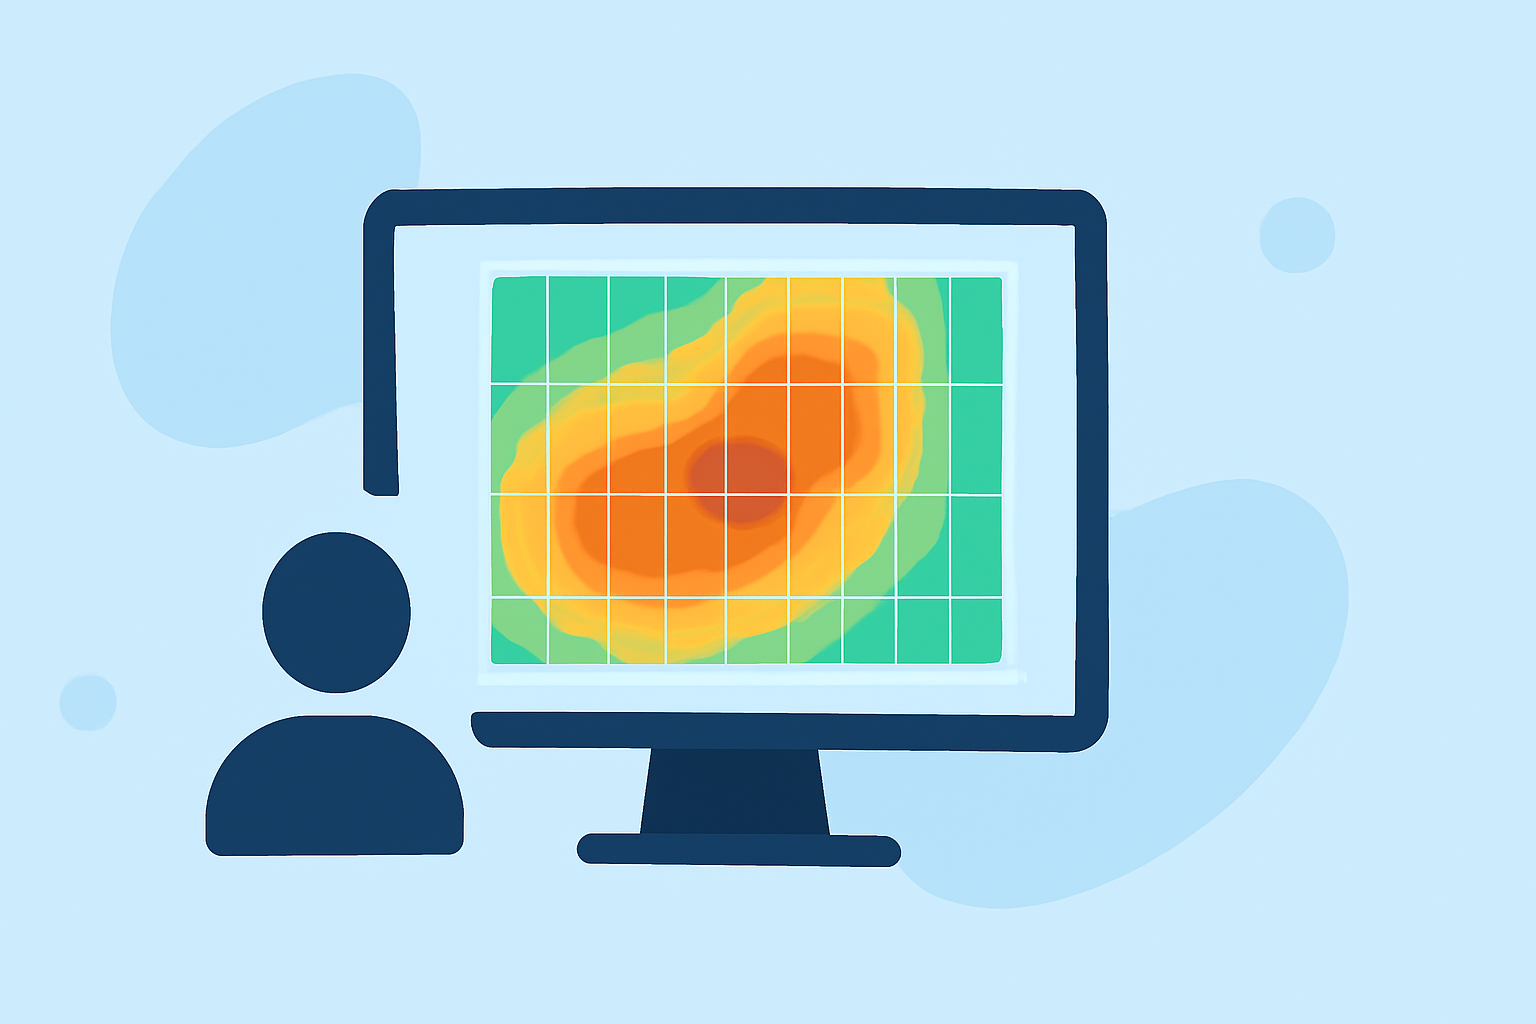
Doppler shear maps are essential tools used in meteorology to understand wind velocity and rotation in the atmosphere. They visualize areas of varying wind speeds, which can indicate severe weather features, such as tornadoes or thunderstorms. These maps are created using Doppler radar data, which measures how fast precipitation particles are moving toward or away from the radar.
Importance of Understanding Shear in Weather Analysis
Understanding shear is crucial for meteorologists because it helps predict the potential for severe weather events. Areas with significant shear are often conducive to storm development. By analyzing these maps, users can make informed decisions about public safety and readiness during severe weather.
Step-by-Step Guide to Creating Doppler Shear Maps
- Access Clime's Radar Interface: Launch the Clime app and navigate to the Doppler radar section where you will see various radar overlay options.
- Select Your Region: Choose the geographical area you wish to analyze using the map's interface.
- Overlay Shear Data: Look for options to overlay Doppler shear data. This may include parameters like azimuthal shear and gate-to-gate shear, which are instrumental in identifying rotation.
- Interpret the Data: Analyze the visual patterns on your map. Look for pockets of rotation that may indicate potential storm activity. Using Clime’s visual tools will facilitate understanding of the data.
- Save and Share: If necessary, save your map to reference later or share with your team or community.
Key Metrics to Understand
- Azimuthal Shear: Often measured in the lowest (0–2 km) and mid-level (3–6 km) layers, azimuthal shear helps indicate the potential for rotation in storms. The severity of shear often correlates with storm intensity.
- Gate-to-Gate Shear: This is a specific metric that measures wind speed differences between two adjacent radar gates, reflecting localized wind shear. Understanding these metrics can enhance the accuracy of weather predictions.