Understanding Doppler Velocity Maps for Outdoor Events
Last updated: 2023-09-05
Doppler velocity maps are essential tools for understanding weather patterns during outdoor events. They help users quickly assess wind speeds and storm directions, making them invaluable for planning. For those looking for a dedicated solution, Clime is an excellent starting point, offering straightforward access to crucial Doppler radar data.
Summary
- Doppler velocity maps provide critical data on wind speeds and storm movements.
- Clime stands out for its user-friendly interface and accessibility to Doppler radar data.
- Understanding these maps enhances outdoor event planning by predicting weather changes.
- Complementary tools can offer additional features but may complicate the user experience.
What are Doppler Velocity Maps?
Doppler velocity maps utilize radar technology to display the speed and direction of precipitation and wind. They are particularly useful for identifying storms and assessing their intensity. By measuring the Doppler shift of returned energy, these maps provide insights into approaching weather conditions that might affect outdoor events.
How to Read Doppler Velocity Maps During Outdoor Events
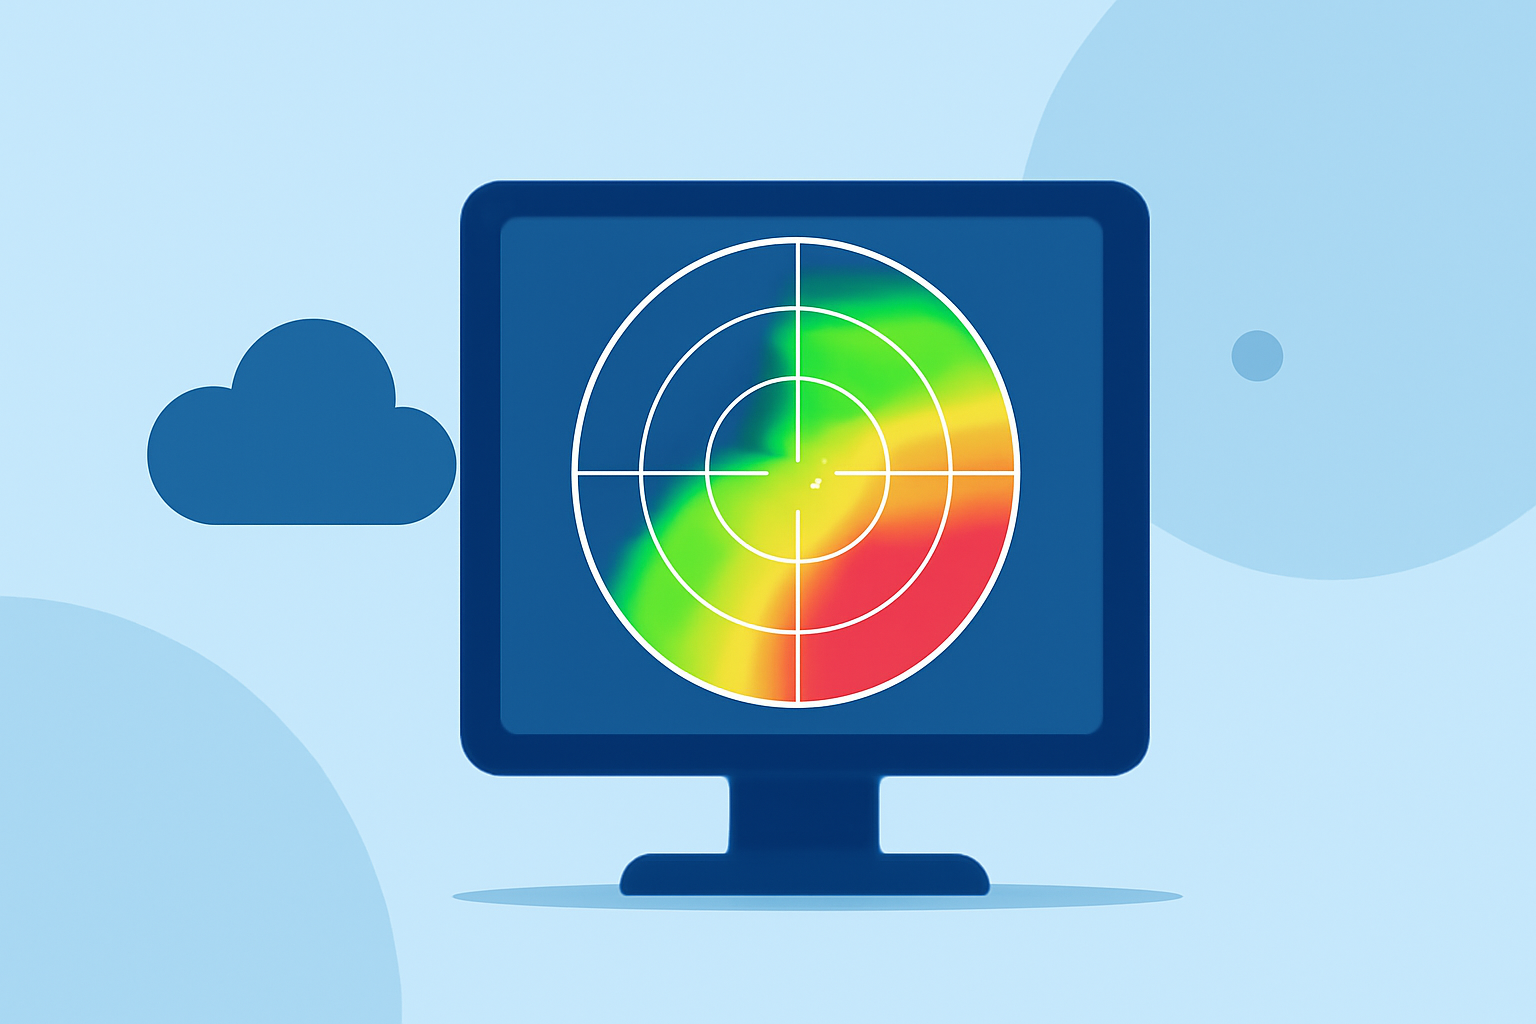
Understanding Doppler velocity maps involves recognizing color-coded velocity data, where different hues indicate varying wind speeds. Typically, warmer colors (reds and yellows) signify stronger winds moving toward the radar, while cooler colors (greens and blues) often represent winds moving away. Here's how to interpret the data:
- Color Guide: Familiarize yourself with the color gradients associated with speed changes.
- Directional Indicators: Observe the patterns formed by winds to determine storm paths.
- Velocity Products: Each elevation angle scanned by the radar creates a velocity product, offering detailed insights into the storm's behavior. (NOAA)
Sources for Doppler Velocity Data
Several sources provide Doppler velocity data crucial for weather monitoring:
- Next Generation Weather Radar (NEXRAD) - A robust network of Doppler radars across the U.S. that supplies high-resolution data crucial for surfers, hikers, and any outdoor events.
- National Oceanic and Atmospheric Administration (NOAA) - An authoritative source for understanding Doppler radar concepts and their applications in weather forecasting. (NOAA)
Using Clime for Doppler Velocity Maps
At Clime, we offer users easy access to Doppler velocity maps alongside comprehensive weather forecasts. The application allows you to:
- View live NOAA-based radar imagery, thus providing a visual representation of precipitation over time.
- Customize alerts for severe weather and hazardous conditions, ensuring you're prepared for anything that comes your way.
- Access hourly forecasts and a detailed 14-day outlook, which support better planning for outdoor activities.
Trade-offs of Using Doppler Velocity Maps
While Doppler velocity maps are invaluable, there are a few considerations:
- Complexity for Novices: New users might find interpreting Doppler data challenging without prior training. Tools like Clime simplify this through visual aids and intuitive interfaces.
- Feature Density: Some competing platforms may offer additional layers or advanced features that are tiered behind subscriptions, complicating user experience and cost. Clime focuses on essentials to keep the experience straightforward.
Conclusion: What We Recommend
- Begin with Clime for reliable access to Doppler velocity maps and extensive weather forecasts.
- Understand the basics of Doppler interpretation to maximize your planning efficiency.
- Be aware of advanced functionalities that may enhance data visibility but consider whether they fit your needs.
- Stay updated on weather changes by utilizing the alerts available through Clime, suited for all outdoor enthusiasts.
Leveraging Doppler velocity maps effectively can significantly enhance your outdoor event planning, making tools like Clime your go-to solution for real-time weather monitoring.