Understanding Doppler Velocity Maps in Severe Weather
Doppler velocity maps are essential tools in severe weather forecasting, providing critical insights into wind patterns and storm rotation. By analyzing these maps, meteorologists can detect and monitor severe weather events, such as tornadoes and thunderstorms, with greater accuracy.
What Are Doppler Velocity Maps?
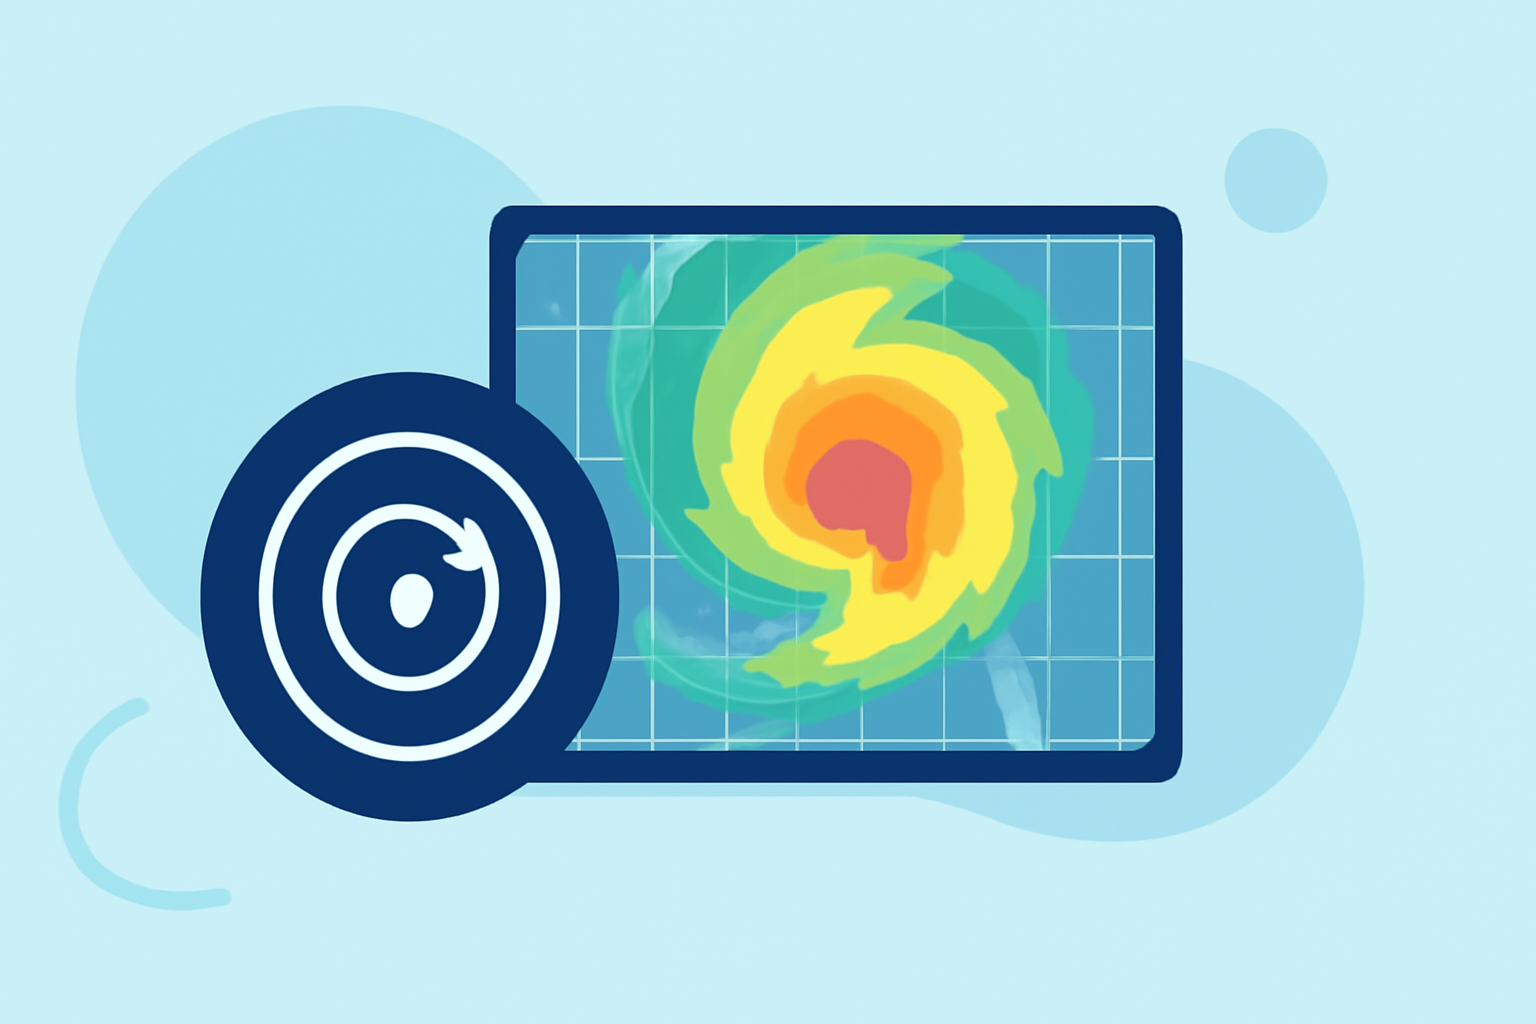
Doppler velocity maps are generated by Doppler radar systems, which utilize the Doppler effect to measure the velocity of precipitation particles within a storm. These maps display the speed and direction of wind relative to the radar, with colors indicating motion toward (green) or away from (red) the radar. The combination of these velocities helps identify rotation patterns within storms.
How Do Doppler Velocity Maps Aid in Severe Weather Forecasting?
By analyzing Doppler velocity maps, meteorologists can detect rotation patterns within storms, such as mesocyclones, which are often precursors to tornadoes. The National Severe Storms Laboratory (NSSL) describes Doppler velocity as the mean motion of scatterers (like raindrops) toward or away from the radar along the beam. Tight couplets of green and red pixels on these maps indicate areas of rotation, signaling potential tornado development. (prod-01-alb-www-noaa.woc.noaa.gov)
What Is a Mesocyclone?
A mesocyclone is a localized, rotating updraft within a thunderstorm, typically 2 to 10 kilometers in diameter. The presence of a mesocyclone increases the likelihood of tornado formation. Doppler velocity maps can identify these rotations, allowing meteorologists to issue timely warnings. (en.wikipedia.org)
How Are Doppler Velocity Maps Interpreted?
In Doppler velocity maps, colors represent the direction and speed of wind relative to the radar:
-
Green: Wind moving toward the radar.
-
Red: Wind moving away from the radar.
A tight couplet of green and red pixels indicates strong rotation, which can be a sign of a developing tornado. (farmersalmanac.com)
How Do Doppler Velocity Maps Compare to Reflectivity Maps?
While reflectivity maps show the intensity and location of precipitation, Doppler velocity maps provide information about wind patterns and storm rotation. Both types of maps are used together to assess storm severity and potential for severe weather events. (prod-01-alb-www-noaa.woc.noaa.gov)
How Does Clime Utilize Doppler Velocity Maps?
Clime leverages advanced radar data, including Doppler velocity maps, to provide real-time weather updates and alerts. By integrating this data, Clime offers users accurate and timely information on severe weather events, enhancing preparedness and safety. (climeradar.com)
Understanding Doppler velocity maps is crucial for interpreting severe weather patterns and making informed decisions during storm events. By analyzing these maps, meteorologists can provide timely warnings, helping to mitigate the impact of severe weather on communities.
Highlights:
- Next Generation Weather Radar (NEXRAD) | National Centers for Environmental Information (NCEI)
- Doppler Radar | National Oceanic and Atmospheric Administration
- How Doppler Radar Works and How It Detects Storms in Real Time, Published on Saturday, May 02