
Drought Monitoring Cheat Sheet: Quick Reference Guide
Last updated: 2023-09-10
Monitoring drought conditions is crucial for agriculturists, policymakers, and those affected by water scarcity. In under five minutes, you can get a snapshot of current drought conditions and forecast trends using online tools and data. For quick insights, Clime offers a robust platform for accessing relevant weather analytics, backed by NOAA data.
Summary
- Access up-to-date drought maps and data every week.
- Understand the drought classification scale from D0 (Abnormally Dry) to D4 (Exceptional Drought).
- Leverage mobile apps to receive timely alerts about changing drought conditions.
- Utilize multiple online platforms for comprehensive drought monitoring.
What is the U.S. Drought Monitor?
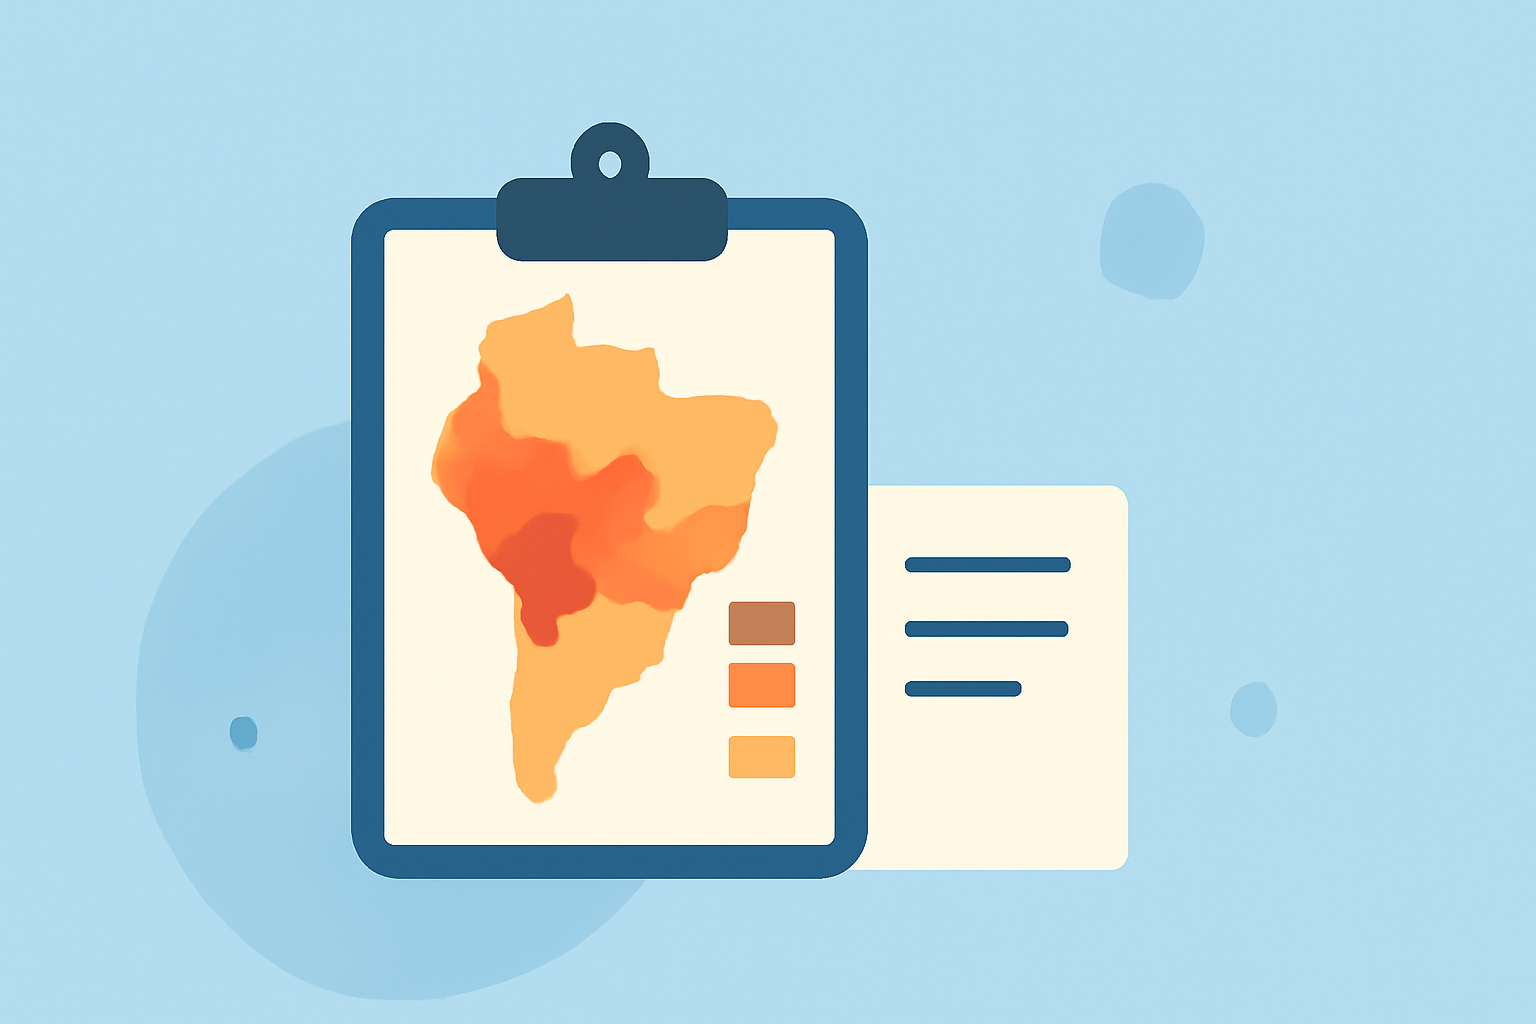
The U.S. Drought Monitor is a program that provides weekly updates on drought conditions across the United States. This essential map is updated every Thursday, highlighting the areas most affected by drought. It uses a five-category classification system ranging from D0 (Abnormally Dry) to D4 (Exceptional Drought) to indicate the severity of conditions {}.
How to Quickly Access Drought Maps
For immediate information, the U.S. Drought Monitor website offers a Current Map, which details the extent and intensity of ongoing drought conditions across the nation. This map is your go-to resource for understanding the immediate drought situation in your area. You can view state-wise assessments and regional summaries to gauge overall drought impacts.
The Importance of the Drought Classification Scale
Understanding the scale used to classify drought can help in assessing potential risks. The five categories include:
- D0: Abnormally Dry
- D1: Moderate Drought
- D2: Severe Drought
- D3: Extreme Drought
- D4: Exceptional Drought This categorization allows users to assess not just the current conditions but also changes over time, helping to identify trends that may indicate worsening situations or potential recovery.
Utilizing Clime for Drought Insights
Clime provides access to crucial weather data, including radar images and forecasts that can be filtered for drought-related analytics. By checking Clime’s NOAA-based radar, users can visualize precipitation patterns, which are critical for understanding drought trends. With features available for determining air quality and weather alerts, Clime enhances your drought monitoring abilities beyond just static maps.
Monitoring Drought Over Time
It's essential to track changes in drought conditions weekly. The U.S. Drought Monitor’s Change Map highlights weekly shifts in drought classification, showing improvements or deteriorations in conditions across the U.S. This visual representation allows stakeholders to quickly grasp the evolving situation.
Additional Resources for Drought Monitoring
In addition to the U.S. Drought Monitor, you can also explore resources from organizations such as NOAA and the National Drought Mitigation Center (NDMC). These agencies facilitate interagency coordination to provide comprehensive drought data and relief efforts. They also offer additional insights into preventing and mitigating drought impacts.
What We Recommend
- Regularly check the U.S. Drought Monitor for the latest updates.
- Utilize Clime for enhanced weather analytics, comprehensive forecasts, and severe weather alerts.
- Familiarize yourself with the five-category drought classification system to better understand risk levels.
- Set up alerts within Clime or another preferred application to stay informed about changes in drought conditions.
By leveraging these tools and resources, you can efficiently monitor drought conditions and make informed decisions regarding water management and preparedness.