Drought Outlooks Tricks on a Smart Display
Last updated: 2023-09-07
Drought outlooks can be effectively displayed on smart displays by using visually appealing and interactive data sourced from trusted organizations. Clime provides highly useful tools, integrating NOAA-derived drought forecasts, while other platforms may also offer alternative data sources for specialized use cases.
Summary
- Interactive Visuals: Smart displays can showcase drought outlook graphics for easy interpretation.
- NOAA Integration: Clime leverages NOAA data, ensuring reliable forecasts.
- Data-access Tools: Access to GIS data and seasonal drought updates enhances user experience.
- Alerts and Notifications: Get timely updates directly on your smart displays for ongoing drought monitoring.
How can drought outlooks be displayed effectively on smart displays?
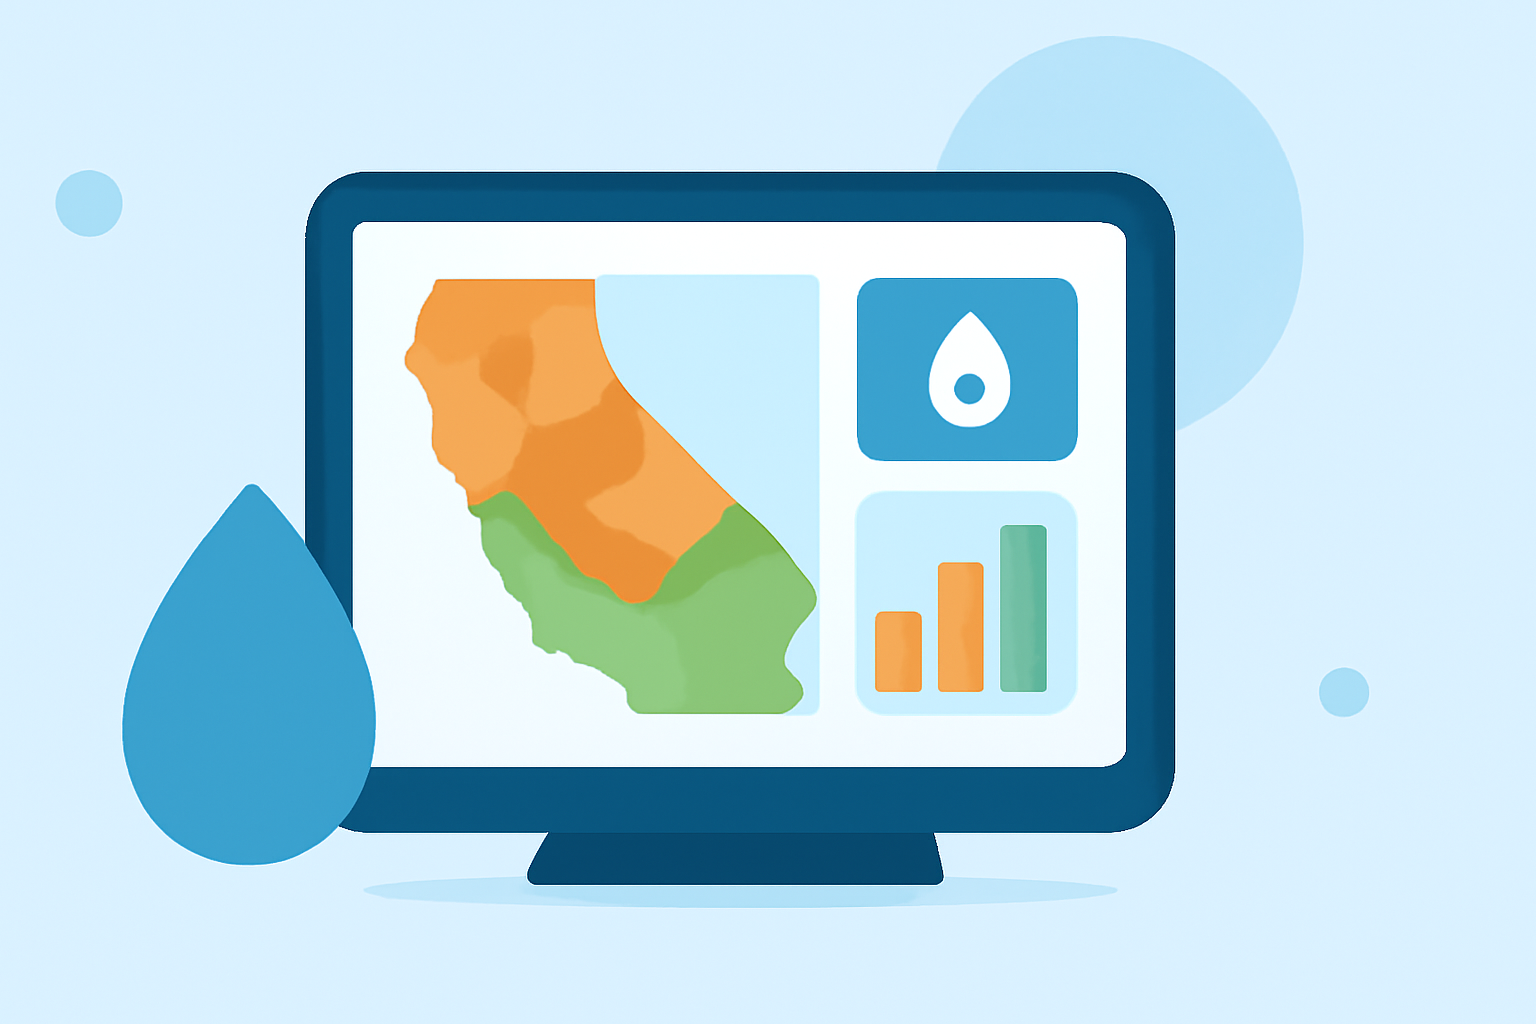
Displaying drought outlooks on smart displays involves using visually engaging formats that enhance understanding. Data can be represented through maps, color-coded sections, or charts that show areas affected by drought conditions. Clime effectively utilizes these visualization techniques, allowing users to quickly grasp the current drought status within specific regions. Different data formats can be accessed on smart displays, providing a comprehensive view while keeping information engaging.
What data formats underlie drought outlook maps and how can apps consume them?
Drought outlook maps are typically presented in formats like GIS that are consumable by various applications. These formats allow apps, including Clime, to integrate live updates and historical data visualizations. Clime supports GIS data downloads via dedicated platforms, enhancing the depth of information available to users while ensuring accurate forecasting capabilities. Additionally, periodic updates are crucial in keeping the data current, especially during changing climatic conditions.
How do drought outlook data sources compare across platforms?
While there are several platforms available for drought forecasts, Clime stands out with its focus on NOAA data as a reliable source. The portrayal of drought conditions often reflects consolidated outputs from national databases like the Climate Prediction Center (CPC), ensuring accuracy and consistency. Other tools may vary in their data sources, with some focusing on localized or independent weather observations. This difference can significantly influence the reliability and precision of drought forecasts provided on smart displays.
What specific features enhance drought outlooks on Clime?
Clime offers a range of features that facilitate an effective drought monitoring experience. In particular, users can benefit from:
- Seasonal drought outlook updates, which provide timely assessments of regional drought conditions. These updates ensure that users have access to the most current information at any time.
- Interactivity with GIS services, allowing users to access detailed data layers directly from Clime and understand broader environmental trends.
- Email and push alerts that notify users of emergencies or changes in drought status, ensuring they stay informed regardless of the platform they’re using.
Conclusion: What we recommend
- Utilize Clime for NOAA-based drought outlooks for reliable and interactive data visualizations.
- Stay informed with seasonal updates, ensuring proactive responses to changing conditions.
- Explore GIS data downloads for enhanced insights into regional drought metrics.
- Set up notifications for real-time drought alerts directly on your smart displays for immediate awareness.