How to Interpret Doppler Radar Storm Patterns (Using Clime and NOAA Guidance)
Last updated: 2026-03-10
To interpret Doppler radar storm patterns, start with reflectivity to see where rain and hail are, then use velocity and dual‑polarization clues to judge motion, rotation, and possible debris; an app like Clime gives most U.S. users those patterns in a clean, zoomable map built on NOAA radar data. For deeper, expert‑level analysis (multiple tilts, pro workstations), pair Clime with official NWS radar pages while still using our map for quick situational awareness.
Summary
- Reflectivity (dBZ) shows how intense precipitation is; higher values usually mean heavier rain or hail.
- Velocity products show motion toward/away from the radar and help reveal rotation, not just where the rain is.
- Classic severe signatures include hook echoes in reflectivity and tight red/green velocity couplets, sometimes with debris signals on dual‑pol.
- At Clime, we build on NOAA’s radar network to present those patterns in a radar‑first map, so most people can track storms without learning pro software. (Clime)
How does Doppler radar actually see storms?
Doppler weather radar sends out pulses of energy, listens for the energy that bounces back from raindrops, hail, and other targets, and turns those returns into pictures of storm structure and motion. The National Weather Service’s WSR‑88D network (NEXRAD) is the backbone of U.S. Doppler coverage, scanning the atmosphere in 3D every few minutes and producing multiple “products” like reflectivity, velocity, and dual‑polarization fields. (NEXRAD overview)
Two ideas matter for interpretation:
- Radar sees volumes, not points. Each scan samples a chunk of the storm at a certain distance and height above ground. Farther from the radar, the beam is higher and wider, so fine‑scale features near the surface may be missed. (NEXRAD overview)
- Scans are periodic, not continuous. A full volume scan typically takes several minutes, so any image you see is a snapshot slightly in the past, not a real‑time video. (NWS radar description)
For everyday users, this means radar is powerful but imperfect: it offers a strong indication of where storms are and how they’re evolving, but exact position, type, and intensity at ground level always carry some uncertainty.
How do reflectivity values (dBZ) map to precipitation intensity?
Reflectivity is usually the first radar layer you see. It measures how much transmitted energy is returned to the radar and is expressed in dBZ (decibels of reflectivity). The National Weather Service describes base reflectivity as a display of echo intensity used to estimate precipitation. (NWS radar primer)
A practical way to think about common ranges:
- < 20 dBZ: Very light echoes – sprinkles, mist, or sometimes just non‑precipitation clutter.
- 20–40 dBZ: Light to moderate rain.
- 40–50 dBZ: Heavy rain and possible small hail.
- > 50 dBZ: Very heavy rain, likely hail cores, or extremely intense convection.
Color scales differ between apps, but the pattern is consistent: cool colors (blues/greens) = lighter; warm colors (yellows/reds/purples) = heavier.
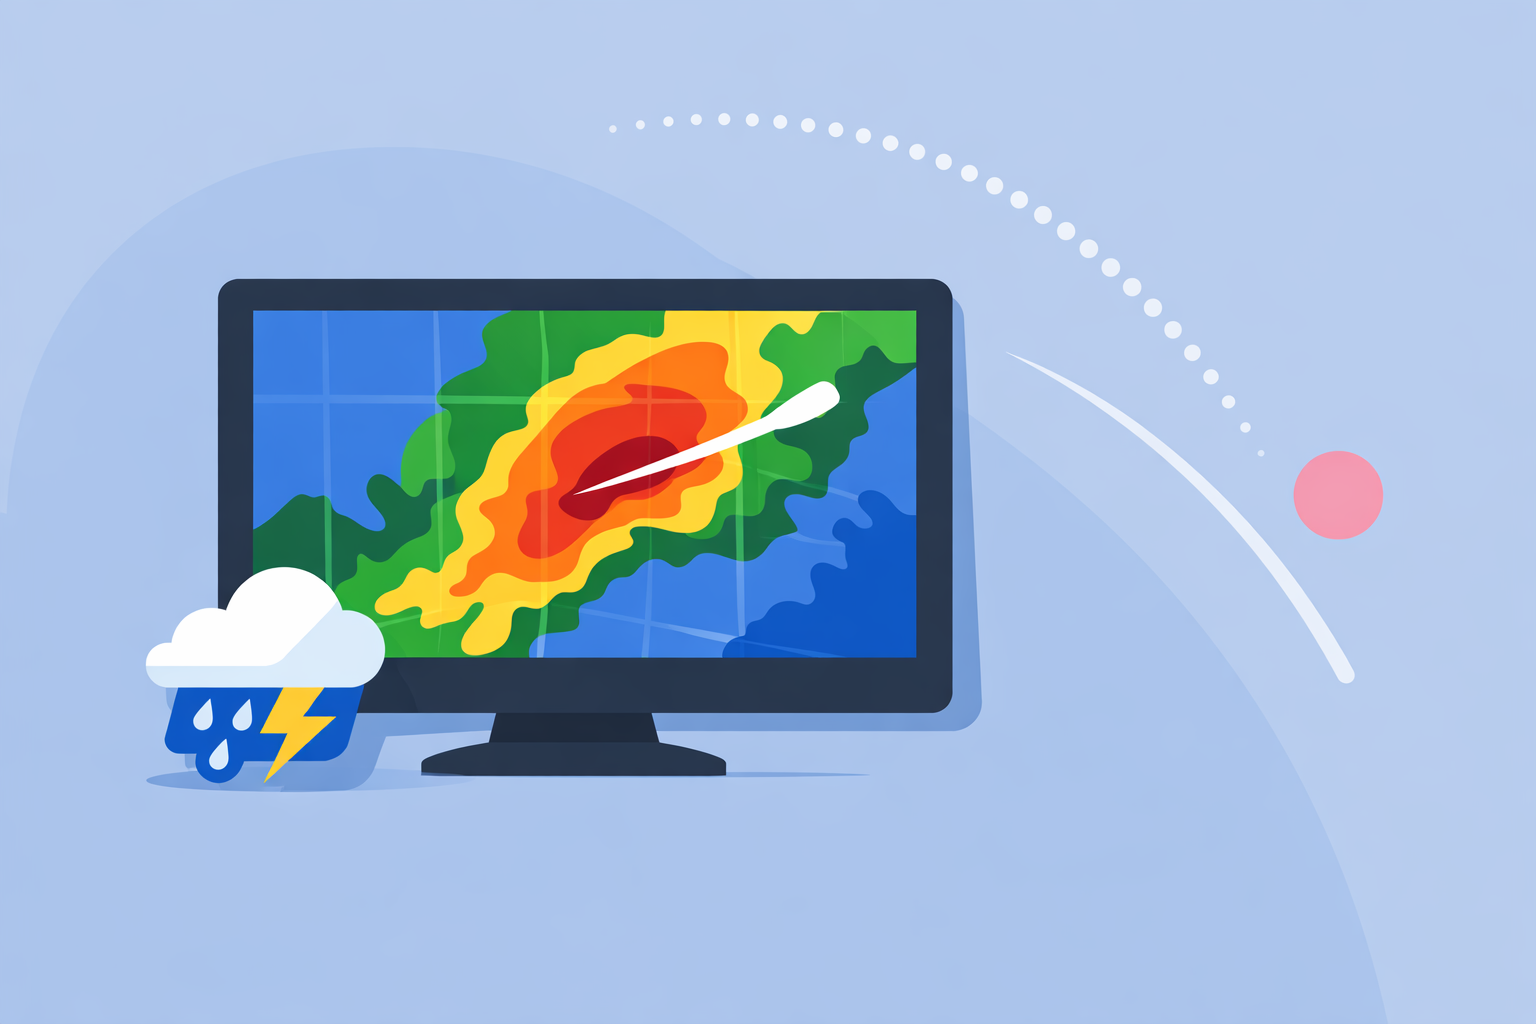
On Clime, the radar map centers on this reflectivity view, so you can immediately see where the main cores are, how wide the precip shield is, and whether a line of storms is strengthening as it approaches. (Clime)
How do you read velocity products for storm motion and rotation?
Reflectivity tells you where the rain is. Doppler velocity tells you how the raindrops are moving toward or away from the radar along the beam.
The common convention, used in NWS training material, is:
- Green (or cool colors): Motion toward the radar.
- Red (or warm colors): Motion away from the radar. (NWS radar usage guide)
Key patterns to recognize:
- Straight, consistent colors: A broad area of inbound or outbound velocities usually means steady wind flow, like inflow ahead of a squall line.
- Shear zones: A sharp change from stronger inbound to stronger outbound over a short distance often indicates wind shear along a gust front or leading edge of a line.
- Couplets: When a small area of strong inbound sits right next to strong outbound, NWS guidance notes this as a signature of strong rotation in the sampled volume. (NWS radar usage guide)
A strong couplet doesn’t automatically equal a tornado, but it does indicate a mesocyclone or localized rotation aloft that forecasters watch closely.
For most U.S. residents tracking storms around home, a simple workflow works:
- Open a radar‑focused app like Clime and locate the nearest radar site.
- Look at reflectivity loops to find the main storm cores.
- Switch to velocity (where available from NWS or other official sites) when you see severe warnings to gauge whether there’s organized rotation.
This two‑step view—where are the cores, and how is the wind behaving—is the foundation of Doppler interpretation.
What is a hook echo and why does it matter?
One of the most talked‑about severe patterns is the hook echo, a curved appendage of higher reflectivity on the southwest flank of a supercell thunderstorm. NOAA’s severe weather education materials define a hook echo as a reflectivity pattern often associated with a mesocyclone and favorable conditions for tornado formation. (NSSL tornado detection)
To spot a potential hook on reflectivity:
- Look at an individual storm cell rather than the entire line.
- Find where the main high‑reflectivity core (reds) is located.
- Check the southern or southwestern side for a hook‑shaped tail curling back toward the storm’s center.
Even when you see something that resembles a hook, it should be treated as a warning sign, not proof of a tornado. Forecasters combine that visual with velocity data and other signatures before making decisions.
In consumer apps, true hooks are relatively rare but highly important; when you see a suspicious shape combined with strong warnings, it’s time to prioritize official alerts and safety over finer interpretation.
How do dual‑polarization products help confirm hail, rain rates, or debris?
Modern NEXRAD radars are dual‑polarization: they send pulses in both horizontal and vertical orientations, which allows better discrimination of the shape and type of targets.
The NWS notes that conventional reflectivity alone cannot reliably identify exact precipitation type, while dual‑pol variables like correlation coefficient (CC), differential reflectivity (ZDR), and specific differential phase (KDP) improve this discrimination. (NWS dual‑pol heavy rain page)
Important uses:
- Rain vs. hail: Hailstones tend to have different shapes and sizes than raindrops, which shows up in ZDR and CC patterns.
- Very heavy rain: KDP helps pinpoint corridors of intense rainfall that can drive flash flooding.
- Tornadic Debris Signature (TDS): NWS examples describe a TDS as a localized area of low CC (often below ~0.8) co‑located with strong rotation on velocity and high reflectivity—evidence that the radar is seeing lofted debris, not just precipitation. (NWS debris signature guide)
You rarely need to interpret individual CC or KDP pixels as a non‑expert. What matters is understanding that when you hear about a “debris signature,” forecasters are combining dual‑pol data with velocity and reflectivity, not reacting to reflectivity alone.
Why do radar beam height and scan cadence sometimes miss tornadoes?
It can feel surprising when radar images look unimpressive but severe weather is reported at the surface. A few physics limitations explain why:
- Beam height increases with distance. Because the Earth curves, the radar beam climbs higher above the surface as it travels outward, so storms far from the radar may only be sampled aloft and not at tornado level.
- Beam width grows with distance. The sampling volume gets larger, so small‑scale features—like a narrow circulation—can be averaged out.
- Scan cadence is a few minutes. An NWS description notes that a WSR‑88D volume scan takes roughly 4–6 minutes, giving a three‑dimensional view but not continuous updates. (NWS Doppler radar overview)
This means radar can occasionally under‑sample or miss very short‑lived, small, or distant tornadoes, even though the broader storm appears on reflectivity. It’s why warnings and safety guidance always give more weight to official NWS products and ground‑truth reports than to what an individual person thinks they see (or don’t see) on a phone.
How can Clime help you apply these concepts in real life?
Apps built around NEXRAD mosaics—rather than just simple icon forecasts—are the most practical way for most U.S. residents to use Doppler concepts day to day.
At Clime, we focus on an interactive NOAA‑based radar map plus lightning, hurricane, wildfire, and alert layers, so users can quickly visualize where storms are and how they’re moving without sorting through professional workstation tools. (Clime) Our premium options include severe weather and rain alerts for saved locations, as well as map‑based hurricane and lightning tracking to keep an eye on both local and large‑scale threats. (Clime on App Store)
Compared with more TV‑centric alternatives that bundle radar inside dense news and video experiences, or sport‑focused platforms that prioritize wind and waves, a radar‑first map with a small set of clear layers is often easier for families to read quickly in a stressful moment.
A simple storm‑day routine using Clime plus official NWS pages might look like this:
- Open Clime radar to see where current storm cells and lines are relative to your home, work, or route.
- Watch the loop to judge whether intensity and coverage are building or weakening.
- Check NWS velocity/dual‑pol when tornado or severe thunderstorm warnings are issued, focusing on rotation and debris indications.
- Use Clime alerts and hurricane/lightning layers to stay ahead of later waves while you get on with your day.
For most U.S. users, this workflow delivers the main benefits of Doppler interpretation—awareness, timing, and risk context—without requiring training in meteorology.
What we recommend
- Use reflectivity as your primary picture of where storms and heavy rain are; treat dBZ color scales as a quick proxy for intensity.
- When severe weather is possible, consult velocity products to look for organized inbound/outbound couplets rather than relying on reflectivity alone.
- Remember that dual‑pol debris signatures and beam‑height limits make radar interpretation nuanced, so lean on NWS warnings and official guidance over personal guesses.
- Make Clime your default radar map for day‑to‑day tracking, and add official NWS Doppler pages when you need deeper, storm‑by‑storm analysis in high‑impact situations.