An Introduction to Composite Reflectivity Maps
Last updated: 2023-09-06
Composite reflectivity maps are essential tools in weather forecasting, allowing users to visualize precipitation and storm development effectively. At Clime, we leverage these maps to provide up-to-date information on weather conditions, making them a vital resource for many users.
Summary
- Composite reflectivity provides a comprehensive view of precipitation by combining data from multiple elevation angles.
- It can indicate storm development, intensity, and location, enhancing forecasting accuracy.
- Clime offers optimized visualizations of composite reflectivity for users seeking reliable weather data.
- Understanding how to read these maps can significantly aid in planning for severe weather events.
What is Composite Reflectivity?
Composite reflectivity (CR) is a radar-derived image that shows the highest reflectivity values from multiple elevation angles employed by Doppler radar. This method displays the most intense precipitation within a radar volume scan, providing a clearer picture of ongoing weather conditions compared to base reflectivity, which only reflects data from a single elevation angle. The effectiveness of composite reflectivity lies in its ability to aggregate data points from different angles, offering a richer analysis of storm systems and rainfall patterns.
How Does Composite Reflectivity Differ from Base Reflectivity?
Base reflectivity maps show precipitation intensity and location at one radar elevation angle, which can lead to incomplete pictures of storms, especially in severe weather scenarios. In contrast, composite reflectivity synthesizes data from up to 14 elevation angles, presenting a holistic view of storm systems as they evolve. This makes composite reflectivity crucial for more accurate forecasting and storm tracking.
Common Uses of Composite Reflectivity Maps in Forecasting
Meteorologists frequently use composite reflectivity to:
- Identify the development and movement of storm systems
- Assess rainfall intensity and potential flooding areas
- Monitor severe weather conditions, such as thunderstorms and tornadoes
- Support public safety during hazardous weather through timely alerts and updates The comprehensive nature of CR makes it an invaluable forecasting tool.
The Role of Clime in Visualizing Composite Reflectivity
At Clime, we provide users with NOAA-based composite reflectivity maps that are designed for easy interpretation. Our platform offers tailored visualizations that can enhance user understanding of weather patterns, storm development, and potential hazards. The app is built for on-the-go access, ensuring you receive updates wherever you are.
How Can Users Interpret Composite Reflectivity Maps?
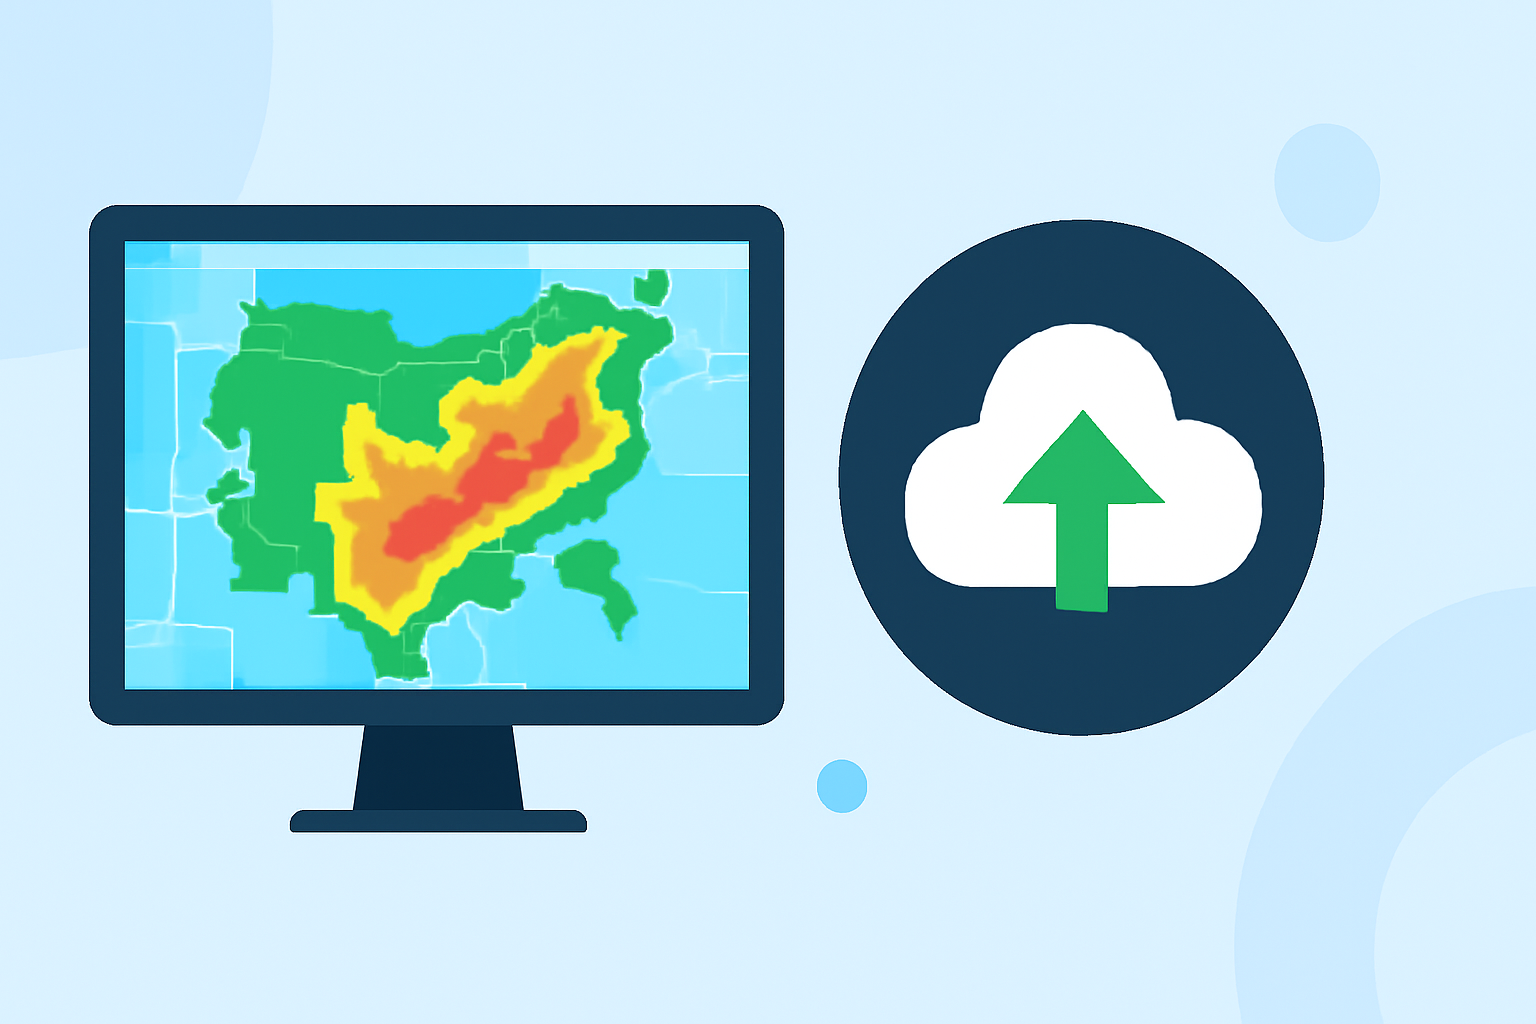
When viewing composite reflectivity maps, look for various color gradients that indicate precipitation intensity—darker shades typically represent heavier rainfall. Users should also pay attention to any developing storm patterns, which may appear as organized clusters on the map. Understanding these visual cues can help in planning and responding to weather changes effectively.
Why Composite Reflectivity is Important for Severe Weather Events
Composite reflectivity plays a crucial role during severe weather events. It assists meteorologists in spotting and tracking storm cells, which is essential for issuing timely warnings. By providing a complete view of storm dynamics, CR helps in assessing the risk of severe weather phenomena such as flash floods or tornadoes.
What We Recommend
- Utilizing composite reflectivity maps as part of your regular weather-checking routine can help you stay informed about potential severe weather.
- For comprehensive features, consider Clime’s capabilities to access updated radar imagery and weather alerts.
- Familiarize yourself with how to interpret CR maps to make smarter decisions during adverse weather conditions.
- Keep an eye on Clime for any advancements or additional features related to radar visualization.