
An Introduction to Storm Maps for Beginners
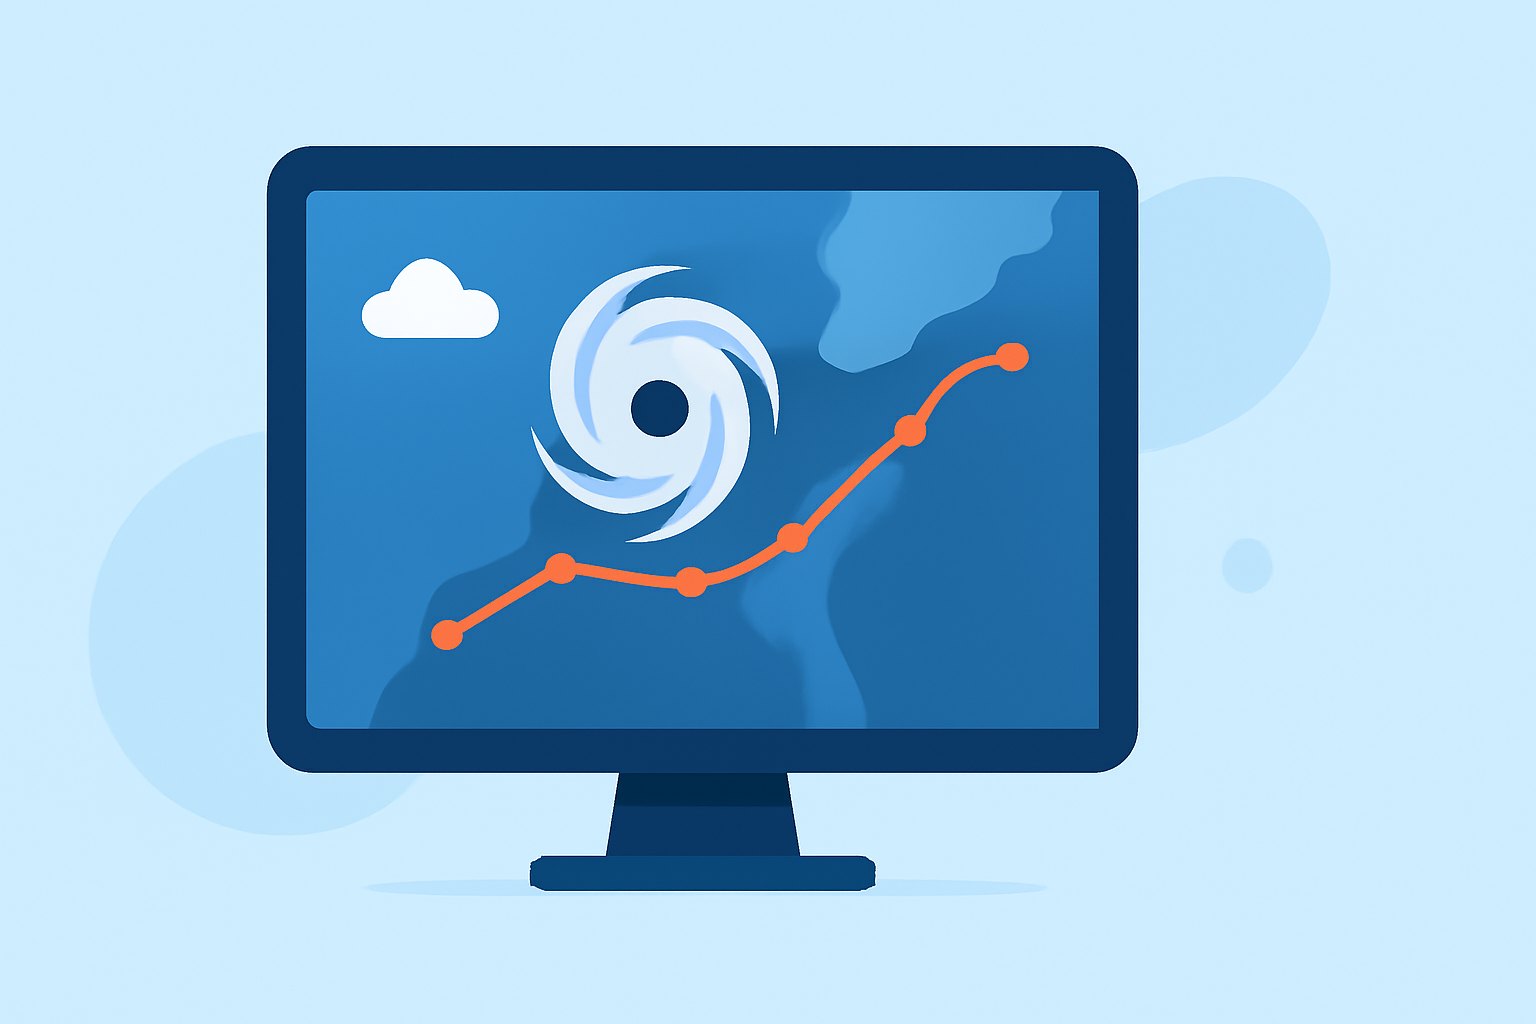
Understanding storm maps is essential for staying informed about severe weather events. These maps provide visual representations of weather conditions, helping you anticipate and prepare for storms.
What Are Storm Maps?
Storm maps are graphical tools that display meteorological data related to severe weather phenomena, such as hurricanes, tornadoes, and thunderstorms. They illustrate the location, movement, and intensity of storms, offering a visual forecast of potential weather impacts.
Key Components of Storm Maps
- Forecast Track Line: Indicates the projected path of the storm's center over time.
- Cone of Uncertainty: Represents the potential error in the storm's forecasted path, highlighting areas that could be affected.
- Wind Speed Zones: Color-coded areas showing expected wind speeds, helping assess potential damage.
- Rainfall and Flood Risk Areas: Shaded regions indicating anticipated rainfall amounts and associated flood risks.
How to Read Storm Maps
- Identify the Forecast Track: Locate the storm's projected path to understand its potential impact on your area.
- Understand the Cone of Uncertainty: Recognize that the storm's actual path can vary within this cone, so stay updated with the latest information.
- Assess Wind and Rainfall Zones: Use color codes to gauge the severity of wind and rainfall, aiding in preparedness planning.
Staying Informed
Regularly monitor storm maps from reliable sources, such as the National Weather Service, to receive timely updates on severe weather events. Utilizing storm tracking tools can enhance your situational awareness and preparedness.
By familiarizing yourself with storm maps and their components, you can make informed decisions to protect yourself and your community during severe weather events.