
An Introduction to Weather Radar Maps
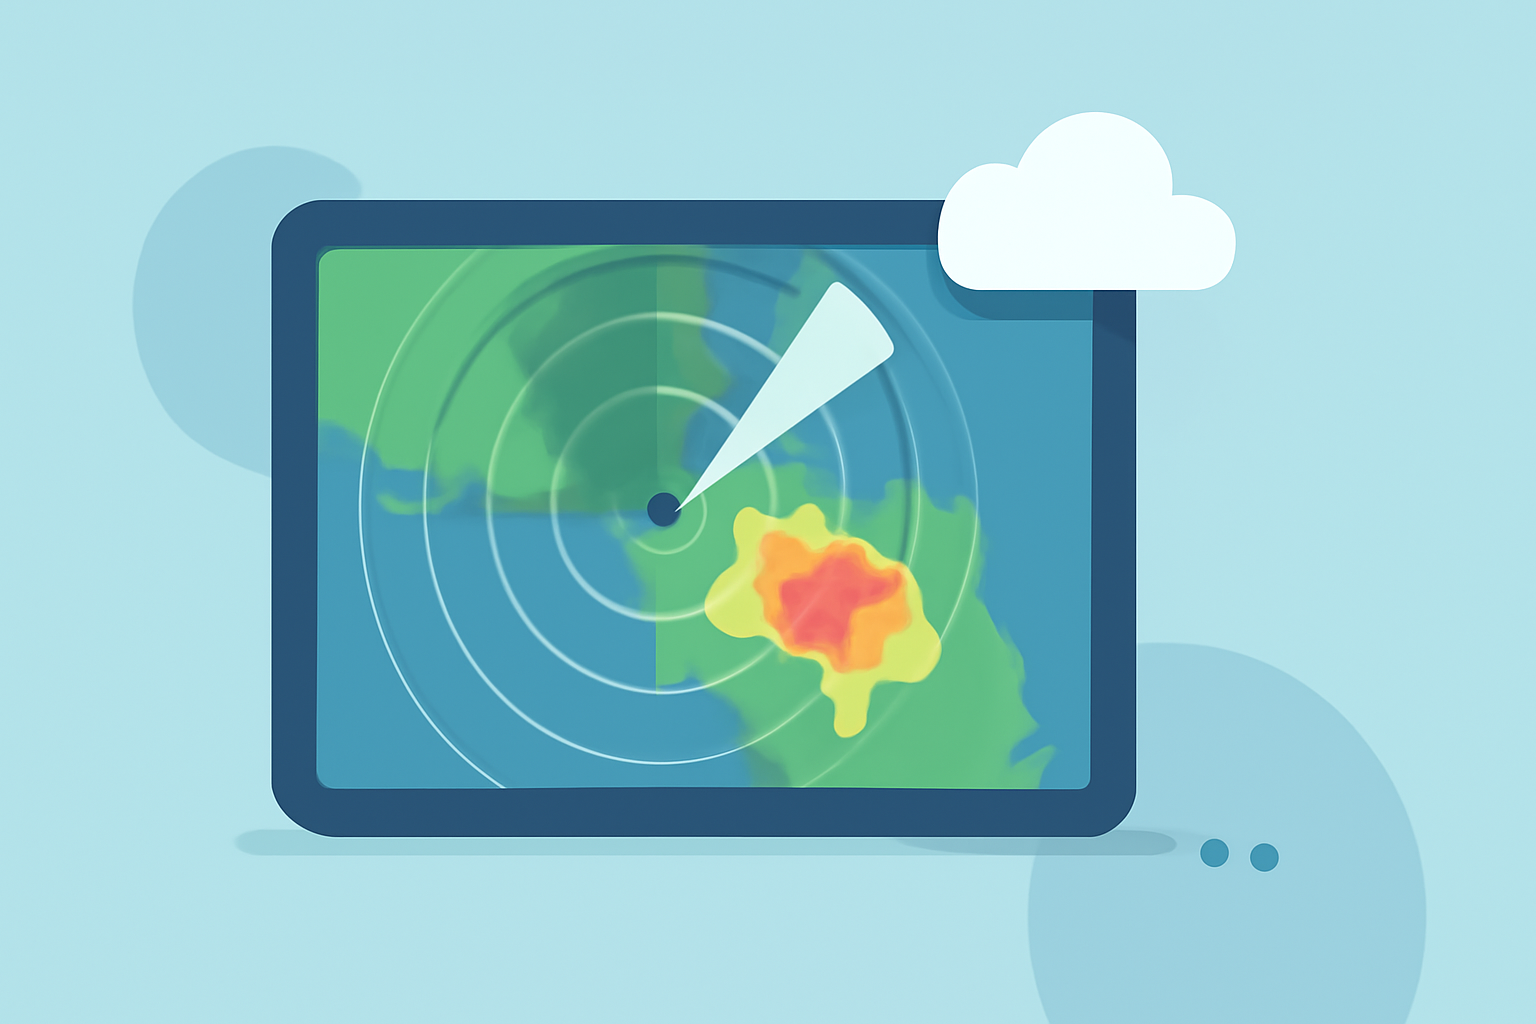
Weather radar maps are essential tools in meteorology, providing real-time insights into precipitation patterns, storm movements, and atmospheric conditions. Understanding these maps enhances our ability to anticipate weather events and make informed decisions.
What Are Weather Radar Maps?
Weather radar maps display data collected by radar systems that emit radio waves to detect precipitation, such as rain, snow, or hail. These maps illustrate the location, intensity, and movement of precipitation, aiding meteorologists in forecasting and issuing warnings for severe weather events.
How Do Weather Radars Work?
Modern weather radars, known as Doppler radars, operate by emitting pulses of electromagnetic energy into the atmosphere. When these pulses encounter precipitation particles, they scatter and reflect some energy back toward the radar. The radar measures the time it takes for the reflected energy to return, determining the distance to the precipitation. By analyzing the strength and frequency shift of the returned signal, the radar can assess the intensity and movement of the precipitation. (prod-01-alb-www-noaa.woc.noaa.gov)
Key Components of Weather Radar Maps
-
Reflectivity: Indicates the intensity of precipitation. Higher reflectivity values correspond to heavier precipitation.
-
Velocity: Shows the speed and direction of precipitation particles, helping to identify wind patterns and potential severe weather phenomena like tornadoes.
-
Dual Polarization: Enhances the ability to distinguish between different types of precipitation, such as rain, snow, or hail, by transmitting and receiving radar waves in both horizontal and vertical orientations. (prod-01-alb-www-noaa.woc.noaa.gov)
Interpreting Weather Radar Maps
Weather radar maps use color gradients to represent precipitation intensity, with colors ranging from light to dark indicating increasing intensity. For example, light blues may represent light rain, while deep reds indicate heavy rainfall. Understanding these color codes is crucial for assessing the severity of weather conditions. (wunderground.com)
Limitations of Weather Radar Maps
While weather radar maps are invaluable, they have certain limitations:
-
Range Limitations: The curvature of the Earth means that radar beams can miss precipitation occurring beyond a certain distance from the radar.
-
Detection Gaps: Some types of precipitation, like light drizzle or virga (rain that evaporates before reaching the ground), may not be detected effectively.
-
Non-Meteorological Echoes: Objects such as birds, insects, or even aircraft can create echoes that may be misinterpreted as precipitation. (media.bom.gov.au)
The Role of Weather Radar Maps in Forecasting
Weather radar maps are integral to forecasting and monitoring weather conditions. They provide real-time data on precipitation patterns, storm movements, and atmospheric conditions, enabling meteorologists to issue timely warnings for severe weather events. By analyzing radar data, meteorologists can predict the development and movement of storms, assess their potential impact, and inform the public accordingly. (ncei.noaa.gov)
In summary, weather radar maps are vital tools that offer detailed insights into precipitation and atmospheric dynamics. By understanding how to interpret these maps, individuals can stay informed about weather conditions and make decisions to ensure safety and preparedness.
Highlights:
- Doppler Radar | National Oceanic and Atmospheric Administration
- How radar works | National Oceanic and Atmospheric Administration
- Understanding Weather Radar | Weather Underground