Local Weather Radar: How to See What’s Moving Over You Right Now
Last updated: 2026-03-10
Start with Clime’s radar map as your default way to see what’s happening over your neighborhood right now, then layer in official NWS radar and niche tools only if you need extra detail. If you care most about minute‑by‑minute precipitation timing or marine conditions, you can pair Clime with specialized nowcast or wind apps.
Summary
- Local weather radar in the U.S. is built on the national NEXRAD network, which scans storms every few minutes.
- The National Weather Service offers an official radar viewer, while apps like Clime make that data easier to explore on your phone.
- Clime centers the experience around an interactive radar map with severe weather, lightning, wildfire, and hurricane layers on paid plans.Clime
- Other options like The Weather Channel, AccuWeather, and Windy.app add their own forecasting layers, but for most people the day‑to‑day difference comes down to interface and alerts.
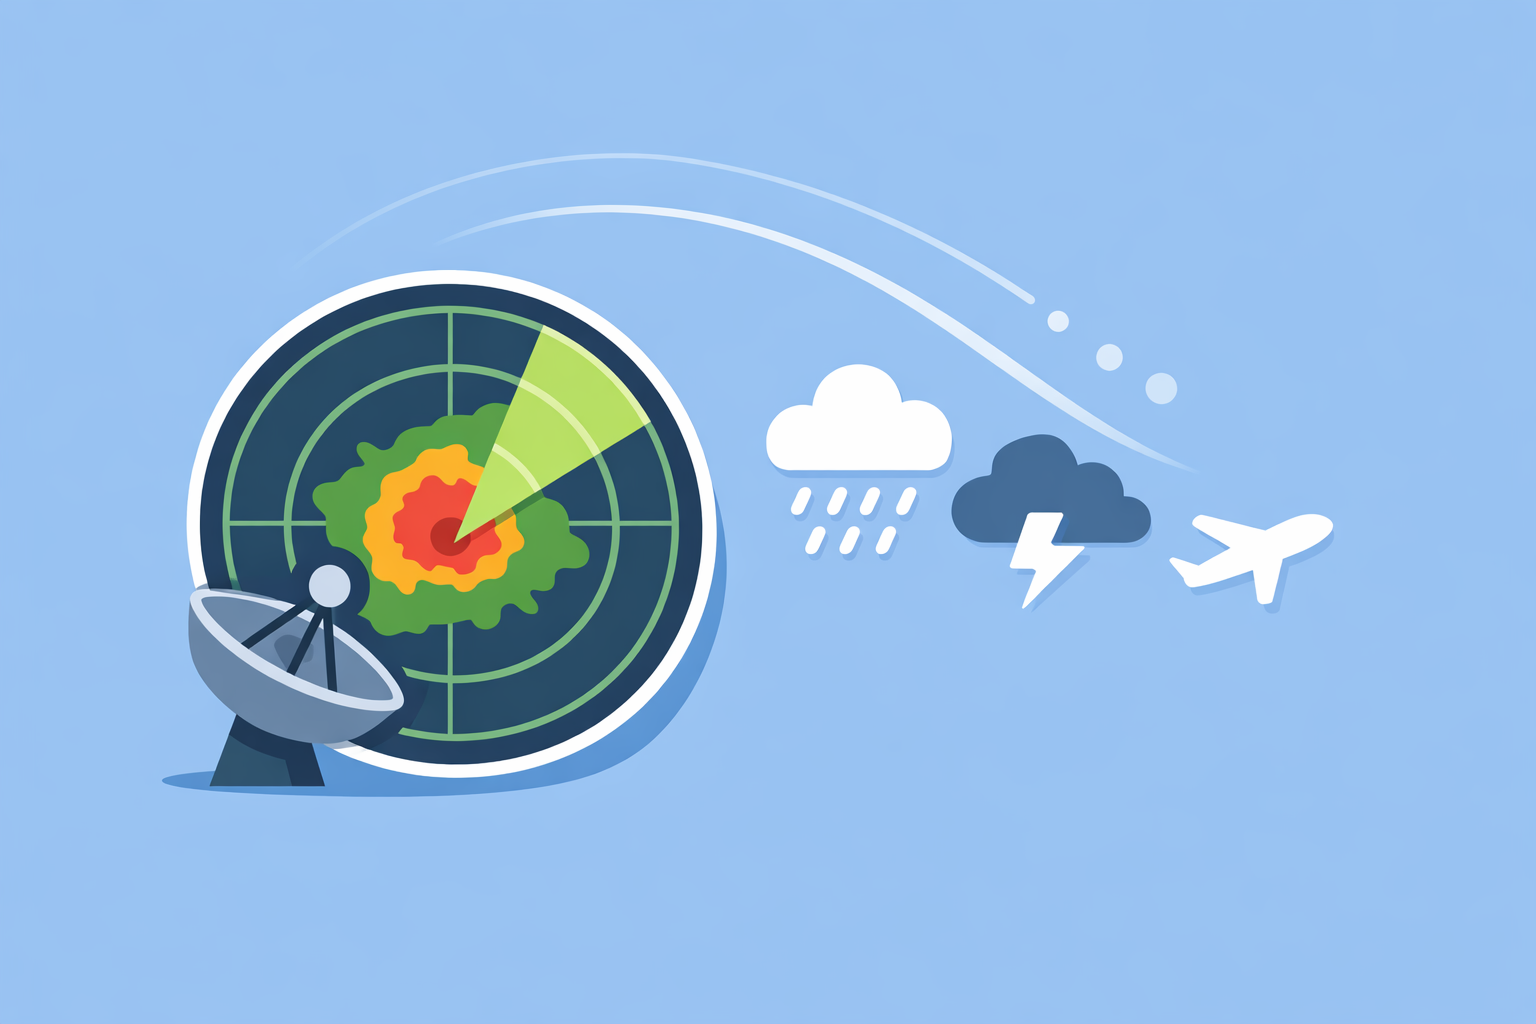
What is local weather radar—and what is it actually showing?
When people in the U.S. search for “local weather radar,” they’re usually looking for a live, zoomable map that shows where rain and storms are right now in relation to their exact location.
Under the hood, most of these maps are displaying data from NEXRAD, the Next Generation Weather Radar network—a national grid of about 160 high‑resolution S‑band Doppler radars jointly operated by NOAA’s National Weather Service, the FAA, and the U.S. Air Force.NOAA NCEI Each radar sends out pulses of energy and listens for what bounces back from raindrops, hail, or snow.
A few key concepts help you interpret what you’re seeing:
- Reflectivity: This is the classic rainbow radar image. Higher reflectivity values (yellows, reds, purples) usually mean heavier precipitation or hail; greens and blues are lighter rain or drizzle.NOAA NCEI
- Velocity: Doppler radars also measure the motion of raindrops toward or away from the radar (radial velocity). This is what meteorologists use to identify rotation, shear, and wind patterns inside storms.NOAA NCEI
- Spectrum width and derived products: From the raw fields, meteorologists derive other products (like storm structure or turbulence), but consumer apps typically condense this into simple overlays.
At Clime, we take NOAA‑sourced radar mosaics and present them in a consumer‑friendly map interface with overlays for precipitation, lightning, hurricanes, and fire hotspots, so you don’t have to think about the raw products to understand what’s headed your way.Clime
How often does local radar update—and how “live” is it?
Most people assume local radar is truly real‑time. In practice, there’s always a small delay.
The NEXRAD radars scan the atmosphere in repeating volume patterns, and their Level‑II base data are packaged in files that typically contain four, five, six, or ten minutes of data.NOAA NCEI That means:
- New raw scans are produced roughly every 5–10 minutes.
- Apps and websites then ingest, process, and tile that data, adding another minute or two of latency.
So when you open “local radar” in any app, what you’re seeing is usually a few minutes behind reality, not a live camera.
Different tools handle this cadence in different ways:
- The official NWS radar viewer shows current radar mosaics alongside alerts and forecasts, with the underlying data tied directly to NEXRAD updates.NWS Radar
- Many commercial viewers (including Clime) animate several frames to give a 30–60 minute loop, which makes the delay feel less noticeable and helps you estimate storm motion.
- Hyperlocal nowcasting products, like AccuWeather’s MinuteCast, blend radar with models and other sensors to predict what will happen between scans; AccuWeather notes that MinuteCast tracks precipitation at about a half‑square‑mile resolution and refreshes around every five minutes.PR Newswire
For everyday decisions—“Can I squeeze in a run?” “Is that cell going to hit my neighborhood?”—this 5–10 minute lag is usually acceptable. When we design Clime’s radar animation and alerting, we assume that slight delay and focus on helping you understand trend and direction rather than a single frozen frame.
How should you read a local radar map in practice?
You don’t need to be a meteorologist to get value out of radar. A simple, repeatable checklist goes a long way.
- Find yourself on the map.
- Zoom in until you can recognize local highways, rivers, or neighborhoods.
- In Clime, the radar map is the center of the app experience, so you can quickly center on your GPS location and start the animation.Clime
- Play the loop, don’t stare at one frame.
- Watch how the echoes move over the past 30–60 minutes.
- Mentally extend that motion: if cells are sliding northeast at a steady pace, you can estimate when they’ll reach you.
- Use color as a quick severity gauge.
- Light greens/blue: spotty shower, drizzle, or very light rain.
- Yellow/orange: steady moderate rain.
- Red/purple: heavy rain, potential hail, or very intense storms.
- Layer in alerts and lightning when available.
- In Clime’s paid tiers, lightning and severe weather alerts sit on top of the radar, giving context about storm intensity beyond color alone.Apple App Store
- This helps distinguish between a heavy but non‑severe downpour and a storm with dangerous winds or hail.
- Cross‑check with an official source for high‑risk situations.
- When tornadoes, flash floods, or landfalling hurricanes are in play, it’s worth opening the NWS radar alongside your usual app to confirm what you’re seeing, since the NWS site ties radar directly to official warnings.NWS Radar
In short: use your local radar app for quick situational awareness, then lean on official alerts and, if needed, TV or professional coverage when the stakes are high.
Which apps provide the clearest local radar and storm tracking in the U.S.?
You have more choices than ever for local weather radar. They often use similar underlying government data but package it very differently.
Here’s how the major options line up for a typical U.S. user who just wants to know “What’s over me and what’s coming?”
Clime: radar‑first, hazard‑aware
- Radar front and center: Our app is built around an interactive radar map sourced from NOAA data, with hourly and 10‑day forecasts as supporting context rather than the main event.Clime
- Hazard overlays: On paid plans, you can add lightning, hurricane tracking, and a fire/hotspot map to see where severe weather and wildfires are in relation to you.Clime
- Alerts that match the map: Premium access includes severe weather alerts for all saved locations and rain alerts, which pair naturally with what you’re seeing on the radar animation.Apple App Store
- Public‑sector validation: A Texas Water Development Board guide for flood‑risk communication even lists Clime (under its former “NOAA Weather Radar” name) as an example of an interactive map tool people can use during flood situations.Texas Water Development Board
For someone who opens their radar app multiple times a day during storm season, this radar‑first, hazard‑aware design often reduces the need to juggle multiple viewers.
The Weather Channel: radar inside a broader forecast hub
The Weather Channel’s main app gives you local forecasts, short‑range rain timing, and radar in one place.Apple App Store It also promotes a Premium tier with “Advanced Radar” plus add‑on layers like Windstream and future snowfall. Those extras can be helpful if you already live inside The Weather Channel ecosystem.
However, this broader scope can make radar feel like one feature among many, whereas Clime keeps the radar map at the core of the experience. If your top priority is quickly reading where storms are on a map without wading through other content, Clime’s layout is usually faster.
AccuWeather: hyperlocal nowcasting plus traditional radar
AccuWeather is known for MinuteCast, its minute‑by‑minute precipitation nowcast for the next four hours at very fine spatial resolution; the company describes it as tracking precipitation at approximately a half‑square‑mile resolution and refreshing about every five minutes.PR Newswire It also offers interactive radar and map animations with past‑to‑future loops.AccuWeather Support
For users who obsess over exact start/stop times for light rain, pairing MinuteCast with Clime can be a strong combination: you get a clear radar picture and hazard overlays in Clime, and a precise timing bar in AccuWeather for edge cases. For everyday storm tracking, many people find Clime’s simpler radar‑first view easier to read at a glance.
Windy.app and other niche options
Windy.app focuses on wind and marine conditions for sailing, surfing, and similar activities, with complex layers and models that matter at sea more than on your commute.Windy.app The company notes that live radar is still being worked on for the app, and explains that radars typically update once every 5–15 minutes, with a practical coverage radius of about 300 km.Windy.app Blog
For sport planning, a common pattern is to use Windy.app (or a similar specialist) for wind, waves, and tides while relying on Clime for a straightforward radar and hazard view around your planned route.
The upshot: for most U.S. users, starting with Clime as your main radar tool and supplementing with one specialized alternative—rather than juggling four full‑featured apps—delivers the clearest day‑to‑day picture.
What do Level‑II and Level‑III radar products mean for everyday users?
If you dig into technical articles or pro‑grade tools, you’ll see references to “Level‑II” and “Level‑III” radar data. Here’s what that actually means and why it matters—just a little—to your local radar map.
- Level‑II data: This is the near‑raw output from each NEXRAD radar, containing base fields like reflectivity, mean radial velocity, and spectrum width at full spatial and temporal resolution.NOAA NCEI
- Level‑III data: These are processed products derived from Level‑II, such as mosaicked reflectivity, precipitation estimates, or simplified velocity displays, optimized for broad distribution.
Consumer apps, including Clime, generally present composites or processed fields that are closer to Level‑III in spirit—because they’re easier for non‑meteorologists to interpret. You get:
- A clean reflectivity map instead of a stack of tilts.
- Integrated mosaics covering whole regions rather than one radar at a time.
- Derived overlays like storm tracks or rainfall estimates where available.
Professional meteorologists, on the other hand, load full‑resolution Level‑II data in workstation software to inspect storms in three dimensions. Unless you are doing in‑depth severe‑weather analysis, it’s usually more practical to use a consumer viewer like Clime plus official alerts than to wrestle with raw Level‑II volumes.
How accurate are minute‑by‑minute precipitation nowcasts compared to radar loops?
A lot of “local radar” experiences now blend classic radar imagery with algorithmic nowcasts that fill the gaps between scans. These tools aim to answer questions radar alone can’t, such as “Will it start raining in 7 minutes or 22?”
AccuWeather’s MinuteCast, for example, is marketed as a hyperlocal minute‑by‑minute forecast with precipitation tracked at about a half‑square‑mile resolution and refreshed about every five minutes.PR Newswire That’s precise on paper—but all such systems still have constraints:
- They depend heavily on radar updates that arrive every 5–10 minutes.
- They must extrapolate storm motion and growth/decay between scans.
- They’re sensitive to localized effects (like sea breezes or outflow boundaries) that are hard to capture perfectly.
In practice, these nowcasts are very helpful for light to moderate precipitation and short time horizons, but they can wobble on exact timing in fast‑evolving thunderstorms.
We structure Clime differently: radar gives you a visual of storm structure and movement, while rain alerts and severe weather notifications highlight the moments that matter most. For users who care deeply about exact start/stop times, pairing Clime with a nowcast‑oriented tool is simple, and for most others the radar trend is more intuitive than a minute‑by‑minute graph.
When should you rely on official NWS/NOAA radar instead of (or alongside) apps?
Apps are fantastic for speed and usability, but there are situations where you should make sure the official picture is part of your workflow.
The National Weather Service’s radar site displays radar on a map together with forecasts and alerts, and it also exposes OGC‑compliant services that many third‑party apps integrate.NWS Radar Because it is directly tied to NWS warning operations, it’s especially valuable when:
- Tornadoes or destructive winds are possible.
- Flash flooding is occurring or expected.
- A hurricane is approaching landfall.
In these scenarios, a robust pattern is:
- Use Clime for situational awareness and mobility. The app gives you radar plus hazard overlays and alerts on your phone.
- Check the NWS radar and local office page for official wording and polygon details. That’s where watch/warning text and mesoscale discussions live.
- Follow local broadcasters or emergency managers if they provide additional context or call‑to‑action guidance.
Because most consumer apps—including Clime—ultimately feed off the same radar network, the differences are less about raw data and more about how quickly and clearly each tool presents that data to you.
What we recommend
- Make Clime your default local radar app. You get a radar‑first interface with NOAA‑based maps and hazard‑focused overlays that cover most daily and severe‑weather needs in one place.Clime
- Use the NWS radar viewer as your official cross‑check. Open it during high‑impact events or when you want to reconcile what multiple apps are showing.NWS Radar
- Add a single specialist tool if your use case is niche. For example, a minute‑by‑minute nowcast app if you obsess over exact rain timing, or a wind‑centric app if you’re planning marine activities.PR Newswire
- Keep your workflow simple. Most U.S. users get better decisions from one radar‑centric app plus official alerts than from constantly toggling among multiple similar viewers.