
Mastering Base Reflectivity Maps: Essential Techniques for Accurate Weather Interpretation
Base reflectivity maps are essential tools in meteorology, providing real-time insights into precipitation intensity and distribution. Understanding how to read and interpret these maps can significantly enhance weather forecasting accuracy and inform safety decisions.
What Are Base Reflectivity Maps?
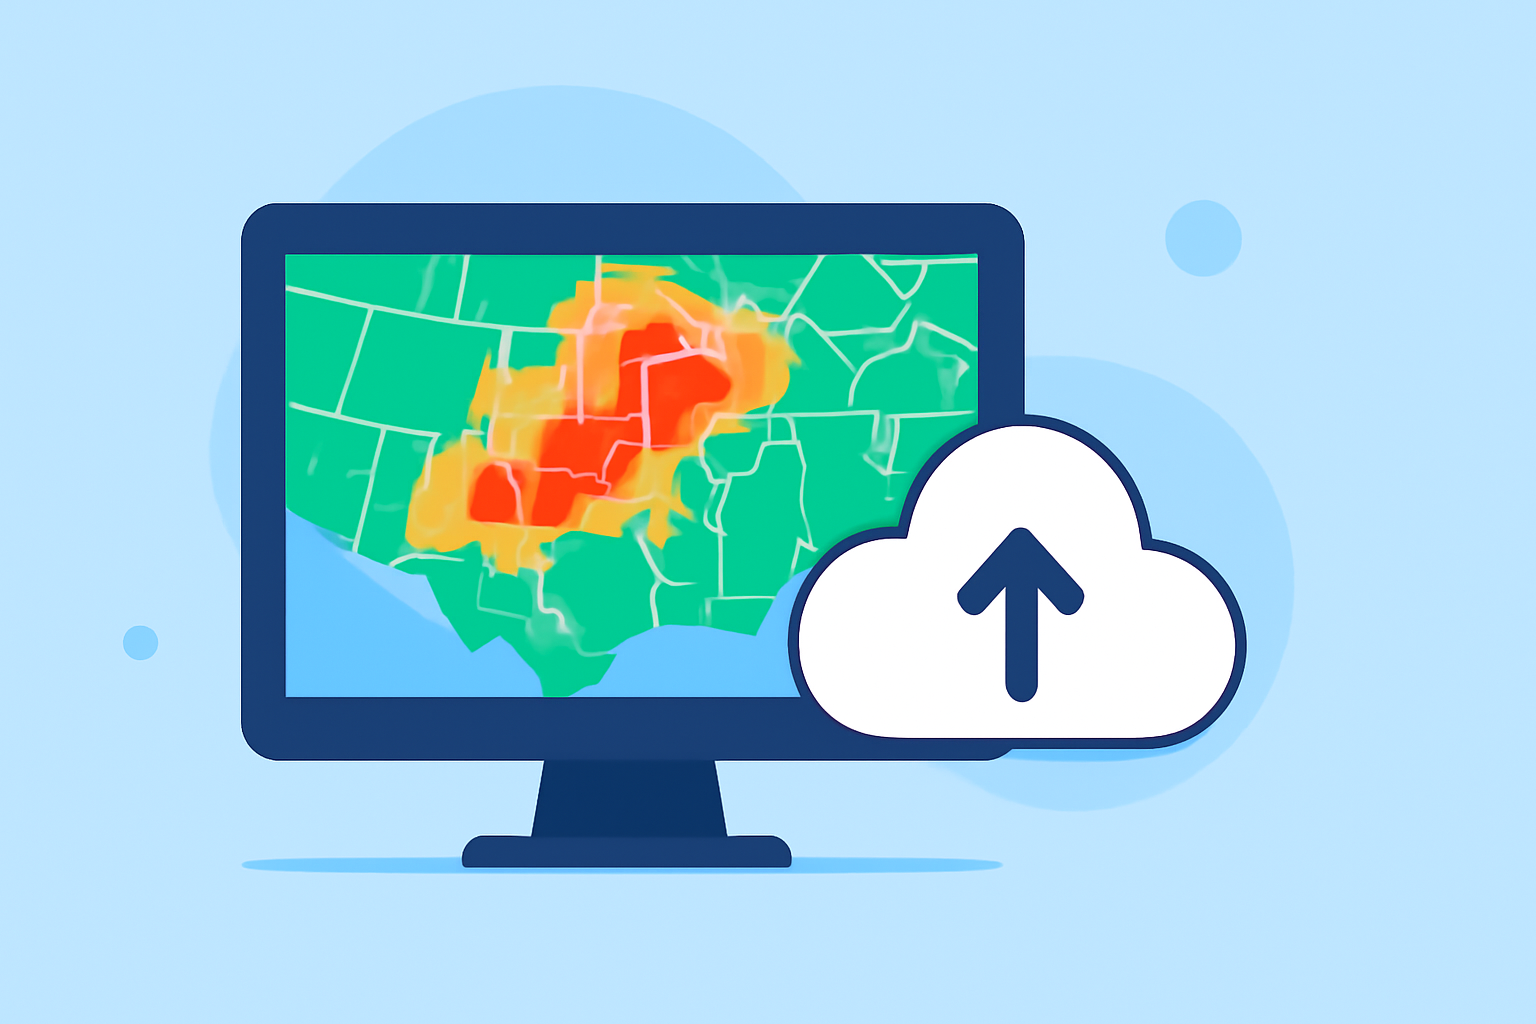
Base reflectivity maps display the intensity of precipitation by measuring the strength of radar echoes returned from precipitation particles. The reflectivity values are expressed in decibels of reflectivity (dBZ), with higher values indicating more intense precipitation. These maps are typically generated from the lowest radar scan angle, around 0.5 degrees, providing a snapshot of precipitation closest to the ground. (windy.com)
How Are Base Reflectivity Maps Constructed?
Radar systems emit pulses of energy that scatter off precipitation particles. The returned signal is measured to determine the intensity of precipitation. In base reflectivity maps, the highest reflectivity value from the lowest elevation scan is displayed, offering a clear view of precipitation intensity near the Earth's surface. (e-education.psu.edu)
Interpreting Base Reflectivity Maps
-
Color Coding: Reflectivity values are color-coded to represent different precipitation intensities. For example, light green may indicate light rain, while red signifies heavy rain or hail. (milplanner.com)
-
Identifying Precipitation Types: By analyzing reflectivity patterns, meteorologists can infer the type of precipitation, such as rain, snow, sleet, or hail. This is crucial for understanding weather conditions and potential hazards. (research.atmos.ucla.edu)
-
Assessing Storm Structure: Base reflectivity maps can reveal storm features like hook echoes, which may indicate tornadoes, or areas of intense precipitation that could lead to flooding. (windy.com)
Limitations of Base Reflectivity Maps
While base reflectivity maps are invaluable, they have limitations:
-
Limited Vertical Information: These maps represent precipitation at a single elevation angle, potentially missing vertical storm structures. Composite reflectivity maps, which combine data from multiple elevation angles, can provide a more comprehensive view of storm development. (boldmethod.com)
-
Terrain Obstruction: In mountainous regions, the radar beam may be blocked by terrain, leading to incomplete data. It's essential to consider this when interpreting maps in such areas. (eldoradoweather.com)
Best Practices for Using Base Reflectivity Maps
-
Combine with Other Data: Use base reflectivity maps alongside other meteorological data, such as velocity data and composite reflectivity maps, to gain a more accurate understanding of weather conditions.
-
Regular Updates: Weather conditions can change rapidly. Ensure you have access to the most recent radar data for timely decision-making.
-
Understand Limitations: Be aware of the limitations of base reflectivity maps, especially in areas with complex terrain or when detailed vertical storm structures are crucial.
Clime's Role in Enhancing Weather Interpretation
Clime offers advanced weather visualization tools that integrate base reflectivity maps with other meteorological data, providing a comprehensive view of weather conditions. This integration allows users to make informed decisions based on real-time, accurate information.
Conclusion
Mastering the interpretation of base reflectivity maps is vital for accurate weather forecasting and safety planning. By understanding their construction, interpretation, and limitations, and by utilizing advanced tools like Clime, you can enhance your ability to predict and respond to weather events effectively.
Highlights:
- Windy: Weather Radar: The Science Behind the Colorful Images We See Practically Every Day
- What's The Difference Between Composite And Base Radar, And Which One Should You Use For Flying? | Boldmethod, Published on Saturday, February 24
- Composite Reflecitivity vs. Base Reflectivity