
Mastering Composite Reflectivity Maps: Essential Tips for Accurate Weather Interpretation
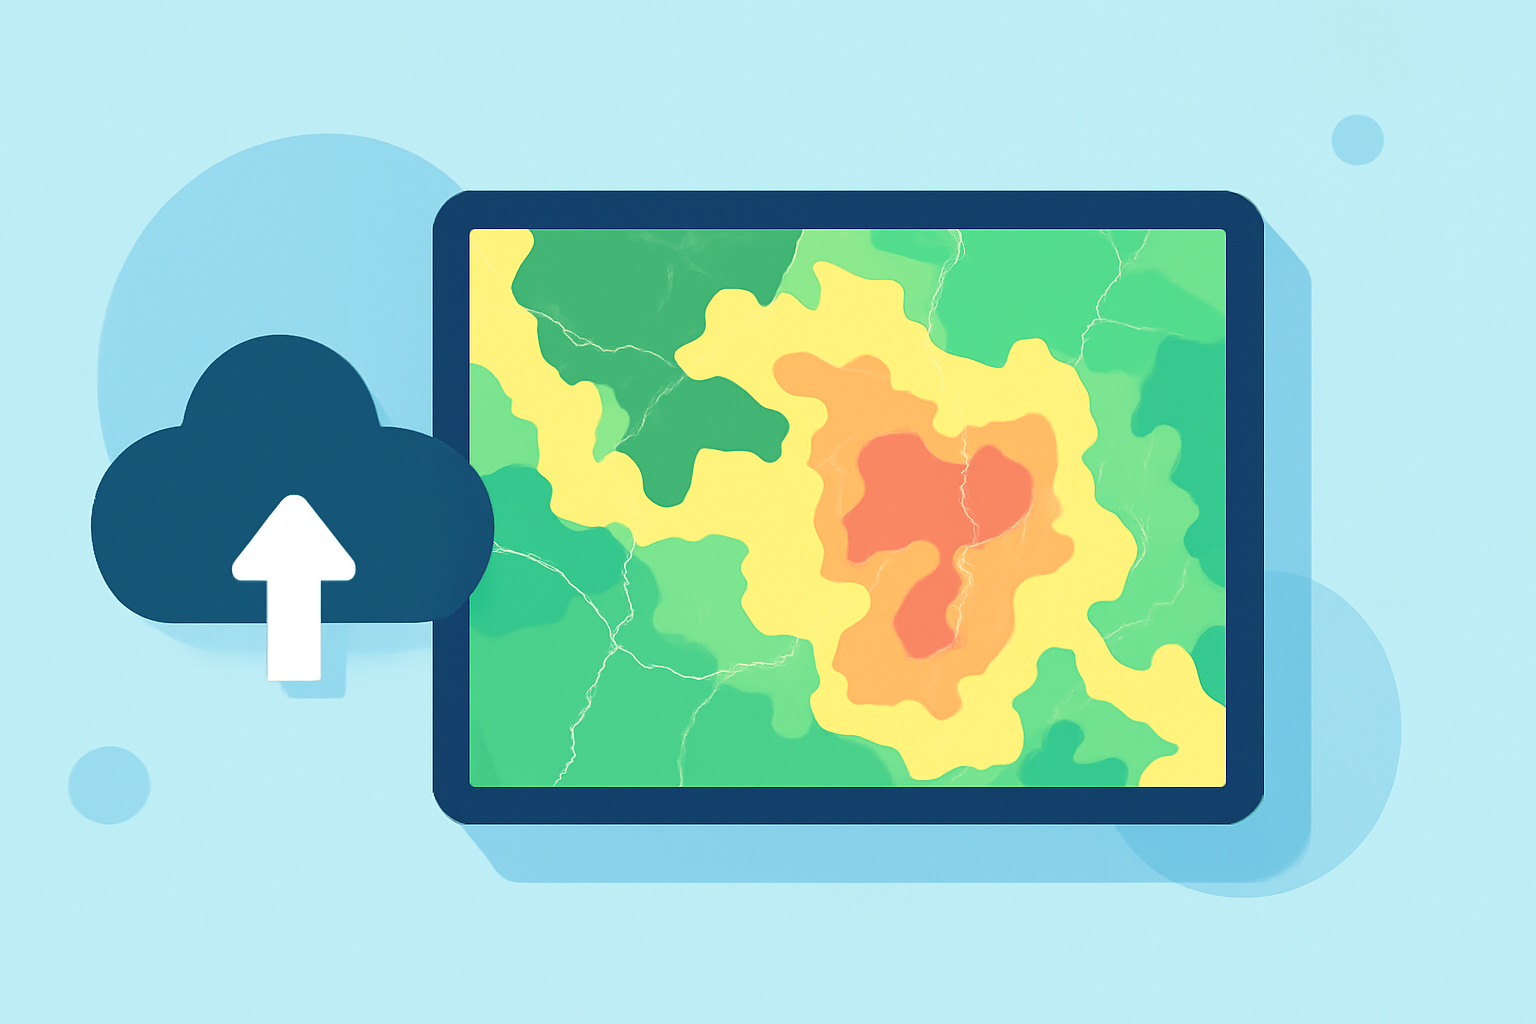
Composite reflectivity maps are invaluable tools for meteorologists and weather enthusiasts alike, offering a comprehensive view of precipitation intensity and storm structures. By understanding how to read and interpret these maps, you can gain deeper insights into weather patterns and make more informed decisions.
What Are Composite Reflectivity Maps?
Composite reflectivity maps display the maximum reflectivity values from all elevation angles during a radar scan. This means they capture the strongest echoes from precipitation at various heights, providing a three-dimensional perspective of storm intensity. Unlike base reflectivity, which shows data from a single elevation angle, composite reflectivity offers a more comprehensive view of the atmosphere's vertical structure. (weather.gov)
How Do Composite Reflectivity Maps Differ from Base Reflectivity?
Base reflectivity images are derived from the lowest (0.5-degree elevation) slice of the radar scan, representing precipitation intensity near the ground. In contrast, composite reflectivity images utilize all elevation scans to display the highest reflectivity values, capturing the most intense precipitation throughout the storm's vertical profile. This distinction is crucial for understanding storm dynamics and potential severe weather threats. (weather.gov)
How to Read Composite Reflectivity Maps
-
Identify Reflectivity Values: Reflectivity is measured in decibels of Z (dBZ), with higher values indicating stronger precipitation. For example, values between 20 and 30 dBZ typically correspond to light rain, while values above 50 dBZ indicate heavy rain or hail. (weather.gov)
-
Understand Color Coding: Colors on the map represent different dBZ values. For instance, green may indicate light precipitation, yellow moderate, and red or purple intense precipitation. Familiarize yourself with the specific color scale used to accurately interpret the data.
-
Analyze Storm Structure: Look for areas of high reflectivity that may indicate severe weather phenomena such as hail or strong winds. The vertical extent of these areas can provide insights into storm development and potential hazards.
Common Misinterpretations to Avoid
-
Assuming Surface Conditions: High reflectivity values aloft do not always translate to severe weather at the surface. For example, a storm may produce heavy rain aloft but only light rain at the ground due to evaporation.
-
Ignoring Storm Movement: Reflectivity maps provide a snapshot in time. Without considering the storm's movement, you may misjudge its potential impact on a specific area.
Enhancing Your Weather Interpretation Skills
To effectively use composite reflectivity maps, it's essential to practice interpreting them in conjunction with other meteorological data, such as velocity scans and surface observations. This holistic approach will improve your ability to assess storm severity and make informed decisions.
By mastering the interpretation of composite reflectivity maps, you can gain a more nuanced understanding of weather patterns, leading to better preparedness and safety during severe weather events.
Highlights:
- NWS Radar: Information the Radar Can Show Us
- About our WSR 88-D Radar
- Interpretation of composite reflectivity, Published on Thursday, May 28