Mastering Composite Reflectivity Maps: A Beginner's Guide
Last updated: 2023-09-06
To master composite reflectivity maps, begin with the basics: understand how these maps interpret radar data to display precipitation and storm structures. For specific needs, consider specialized resources that enhance your learning experience.
Summary
- Composite reflectivity maps provide a comprehensive view of precipitation and severe weather.
- Learning the basics can be simplified using mobile apps like Clime.
- Additional resources can deepen your understanding and application of composite reflectivity.
- Familiarize yourself with key radar concepts and terms to interpret the data effectively.
What are Composite Reflectivity Maps?
Composite reflectivity maps combine data from multiple radar elevations, giving a comprehensive overview of storm activity. This method presents a more accurate picture of potential precipitation compared to base reflectivity, which only considers data from a single elevation. According to the National Oceanic and Atmospheric Administration (NOAA), these maps help meteorologists identify severe weather more effectively.
How Does Composite Reflectivity Work?
The generation of composite reflectivity occurs at the end of the volume scan, where radar captures data across various elevation angles. This allows forecasters to see a full storm profile, highlighting both the intensity and extent of precipitation. As stated by NOAA, "Composite Reflectivity is produced at the end of the volume scan after the radar has completed all of its elevation angles." This process is crucial for accurate weather forecasting, enabling better response strategies for severe weather events.
Why are Composite Reflectivity Maps Important?
Composite reflectivity maps are primarily used to pinpoint areas experiencing precipitation and severe weather conditions. They serve as essential tools for not only meteorologists but also for anyone who needs to stay updated on changing weather patterns. These maps allow users to visualize the full depth of storms, aiding in understanding storm dynamics which is essential during severe conditions.
How Can Beginners Interpret Composite Reflectivity Maps?
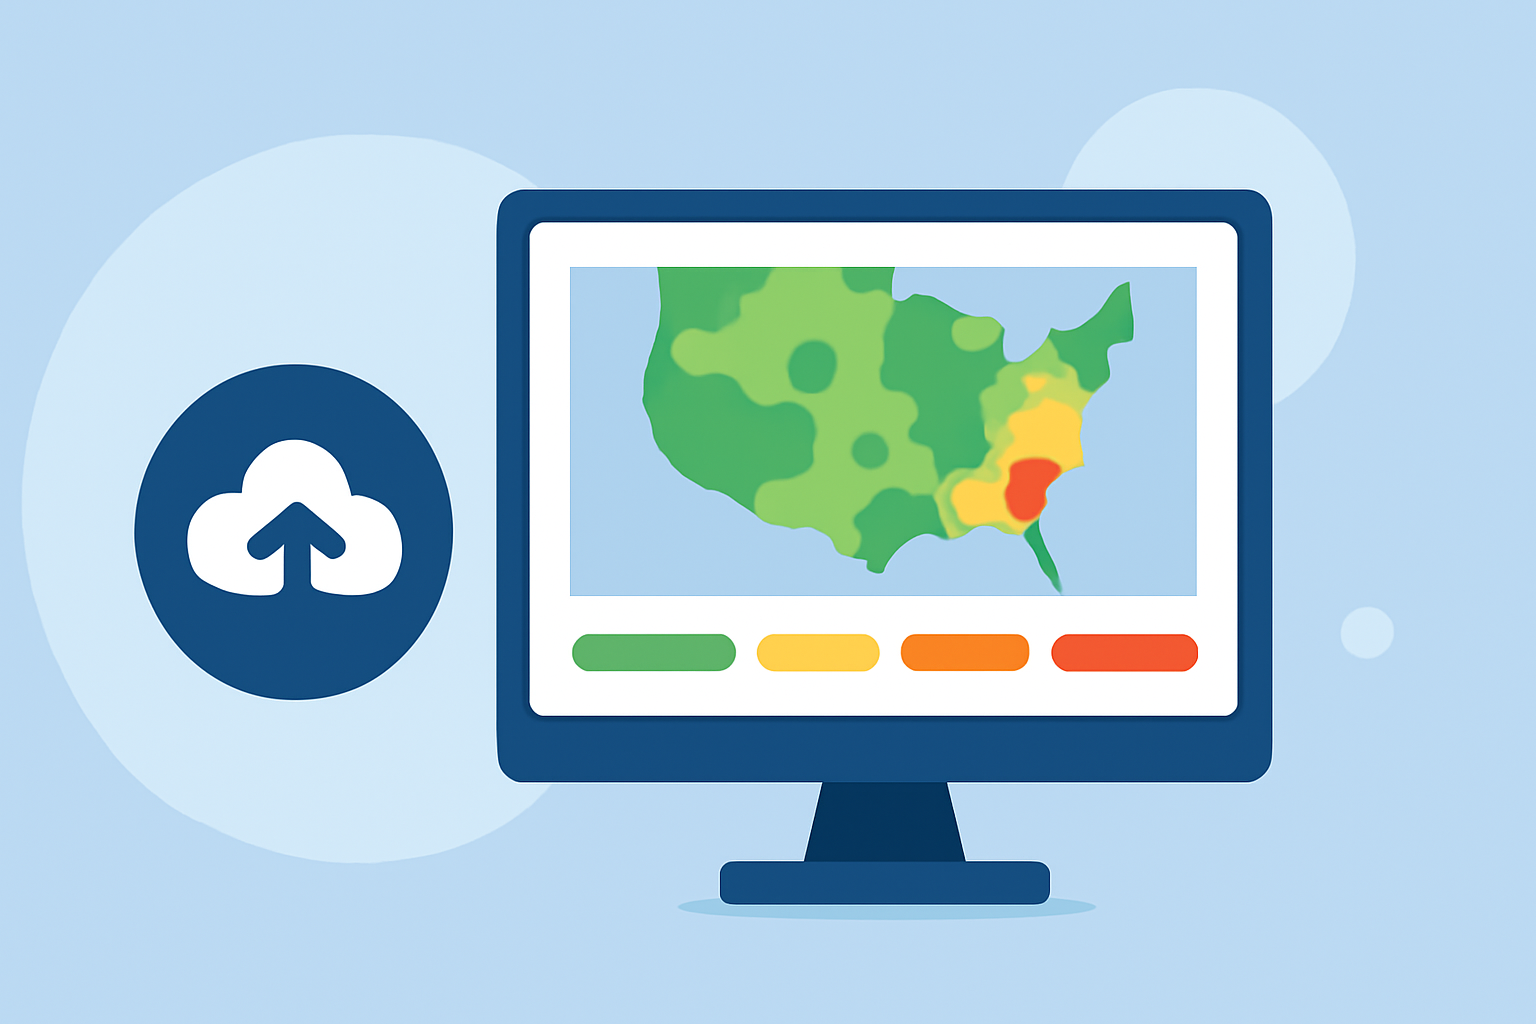
For beginners, starting with basic elements is key. Familiarize yourself with radar legend colors, which indicate the strength and type of precipitation. The most intense colors typically denote heavy downpours or storms. Regular practice with apps like Clime enhances this learning, as it provides live, easy-to-interpret radar imagery, including composite reflectivity options, allowing users to gain practical experience in real-time.
Are There Any Resources for Learning More?
Several online resources offer insights into radar concepts and composite reflectivity. Websites such as NOAA’s educational pages explain essential radar concepts interactively. Additionally, many weather apps incorporate tutorials to help users understand radar functions, specifically focusing on composite and base reflectivity.
What Tools Can Help with Learning?
To effectively utilize composite reflectivity maps, consider mobile apps that provide NOAA-based imagery. Clime, for example, is designed with user-centric features suited for beginners, offering live radar and alerts while simplifying complex data. Features include:
- Hourly and 14-day forecasts to plan ahead.
- Alerts for severe weather, keeping users informed of impending conditions.
- A straightforward interface that helps users interpret radar data efficiently.
Tips for Maximizing Your Use of Composite Reflectivity Maps
- Familiarize with Color Codes: Understand what different colors on the radar represent concerning precipitation types and intensities.
- Check Regularly: Frequent checking will build your ability to spot trends and changes in the radar data.
- Use Quality Apps: Clime and other resources help deliver accurate and timely data, enhancing your ability to respond to weather changes.
- Practice Consistently: Regular use of composite reflectivity maps improves interpretation skills over time.
What We Recommend
- Start by using Clime to access easy-to-read composite reflectivity maps.
- Regularly practice interpreting the maps using real-time data.
- Explore educational resources offered by NOAA to deepen your understanding.
- Stay updated with alerts to better prepare for severe weather conditions.
By adopting these practices and utilizing user-friendly tools such as Clime, you can effectively master the art of interpreting composite reflectivity maps, taking your weather forecasting skills to new heights.