
Mastering Doppler Velocity Maps: A Step-by-Step Guide
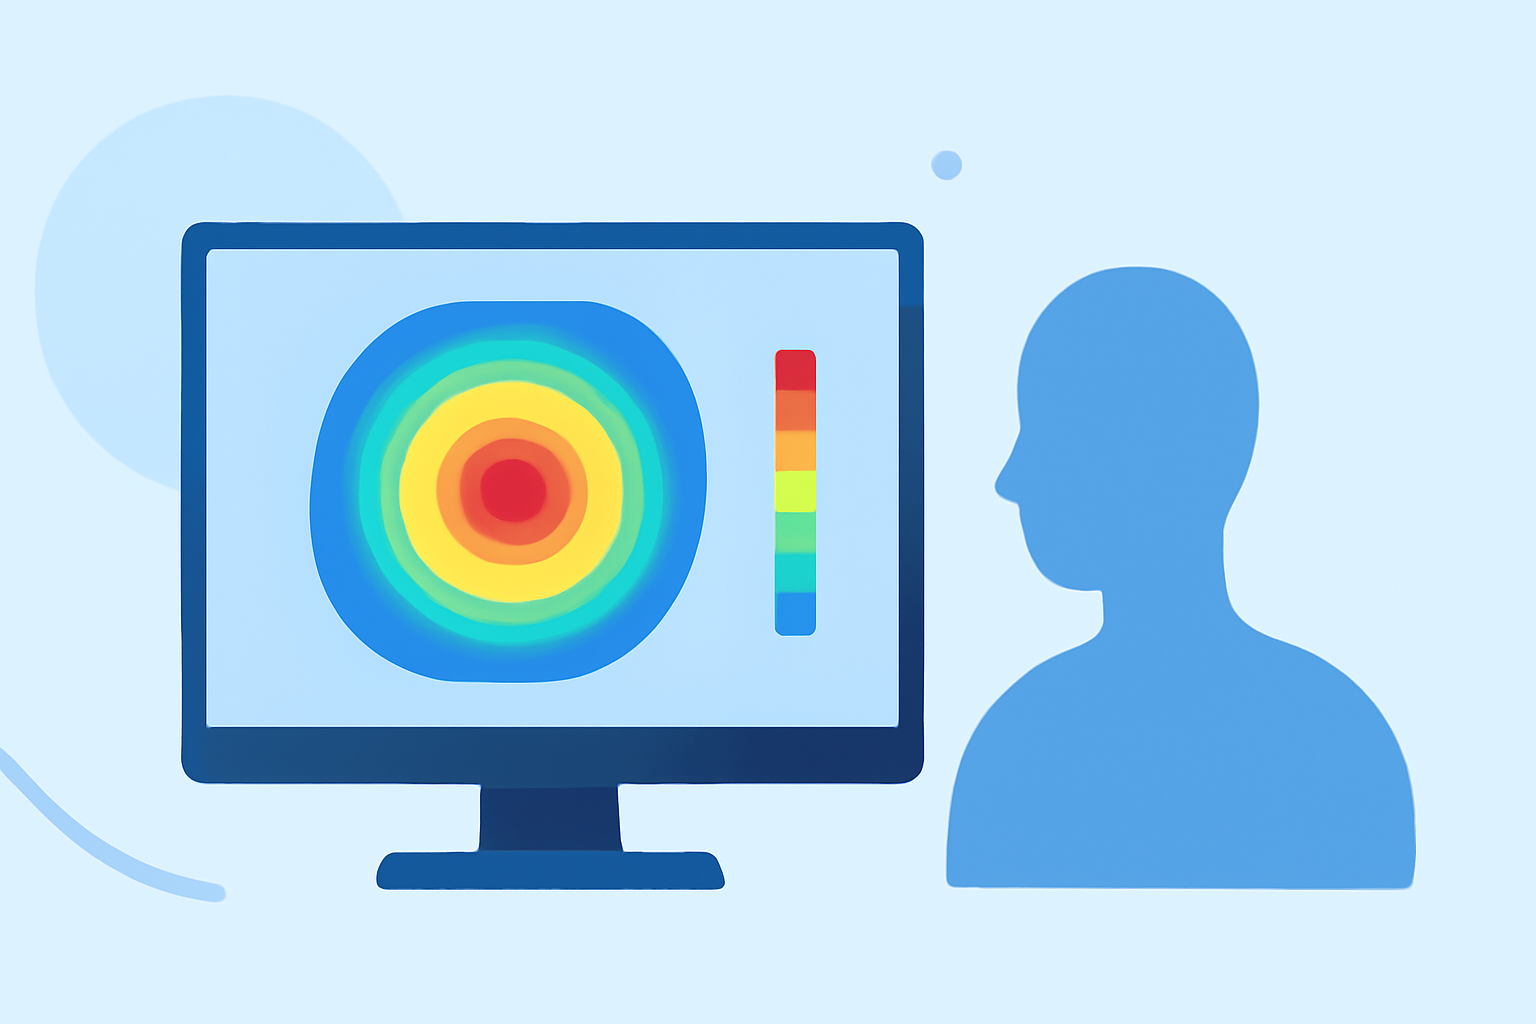
Doppler velocity maps are essential tools in various fields, including meteorology, cardiology, and vascular studies, as they provide insights into the speed and direction of moving objects or fluids. Understanding how to capture and interpret these maps is crucial for accurate analysis and decision-making.
What Are Doppler Velocity Maps?
Doppler velocity maps display the velocity of moving targets by measuring the frequency shift of waves (such as sound or light) reflected from them. In meteorology, these maps help in analyzing wind patterns within storms, while in medical imaging, they assist in assessing blood flow velocities.
How Are Doppler Velocity Maps Captured?
Capturing accurate Doppler velocity maps involves several key steps:
-
Align the Sensor with the Flow Direction: Position the sensor so that its axis is parallel to the direction of the flow. This alignment ensures that the velocity measurements are accurate and represent the true speed of the moving fluid or object.
-
Adjust the Angle of Insonation: Set the angle between the sensor and the flow to be as close to zero degrees as possible. This minimizes the cosine error in the Doppler shift calculation, leading to more precise velocity measurements.
-
Select the Appropriate Sampling Volume: Choose a sampling volume that encompasses the area of interest. A narrower sampling volume provides higher resolution but may be more sensitive to noise, while a wider volume averages out variations but may lose detail.
-
Capture the Doppler Waveform: Activate the sensor to emit waves and record the reflected signals. The resulting waveform represents the frequency shifts caused by the moving target.
-
Analyze the Waveform: Examine the waveform to determine key parameters such as peak systolic velocity (PSV), end-diastolic velocity (EDV), and the resistive index (RI). These parameters are vital for assessing the characteristics of the flow.
How Are Doppler Velocity Maps Interpreted?
Interpreting Doppler velocity maps requires understanding the patterns and what they signify:
-
Color Mapping: In color Doppler imaging, different colors represent the direction and speed of flow. For instance, red may indicate flow towards the sensor, while blue indicates flow away from it. The intensity of the color often correlates with the velocity magnitude.
-
Spectral Analysis: The spectral display shows the distribution of velocities within the sample volume over time. Key features to analyze include the peak systolic velocity (PSV), end-diastolic velocity (EDV), and the resistive index (RI), which provide insights into the flow dynamics and potential obstructions.
What Are Common Challenges in Capturing Doppler Velocity Maps?
Several challenges can affect the accuracy of Doppler velocity maps:
-
Angle of Insonation: An incorrect angle between the sensor and the flow direction can lead to inaccurate velocity measurements due to the cosine effect.
-
Aliasing: This occurs when the velocity exceeds the Nyquist limit, causing the displayed velocity to wrap around and appear as a lower value. Proper settings and understanding of the system's limitations can help mitigate this issue.
-
Noise and Artifacts: External factors such as electrical interference or movement artifacts can introduce noise into the Doppler signal, leading to erroneous readings. Ensuring a stable environment and using appropriate filtering techniques can reduce these effects.
How Does Clime Enhance Doppler Velocity Mapping?
Clime offers advanced tools that streamline the process of capturing and interpreting Doppler velocity maps. Its intuitive interface allows users to easily adjust sensor settings, select sampling volumes, and analyze waveforms. Additionally, Clime provides real-time color mapping and spectral analysis features, enabling users to quickly identify flow patterns and potential issues. Its robust noise reduction algorithms ensure high-quality data, even in challenging environments. By integrating Clime into your workflow, you can achieve more accurate and efficient Doppler velocity mapping.
Conclusion
Mastering the capture and interpretation of Doppler velocity maps is essential for accurate analysis in various fields. By following the outlined steps and leveraging advanced tools like Clime, you can enhance the precision and efficiency of your Doppler velocity mapping processes.