
Mastering Precipitation Maps: A Step-by-Step Guide
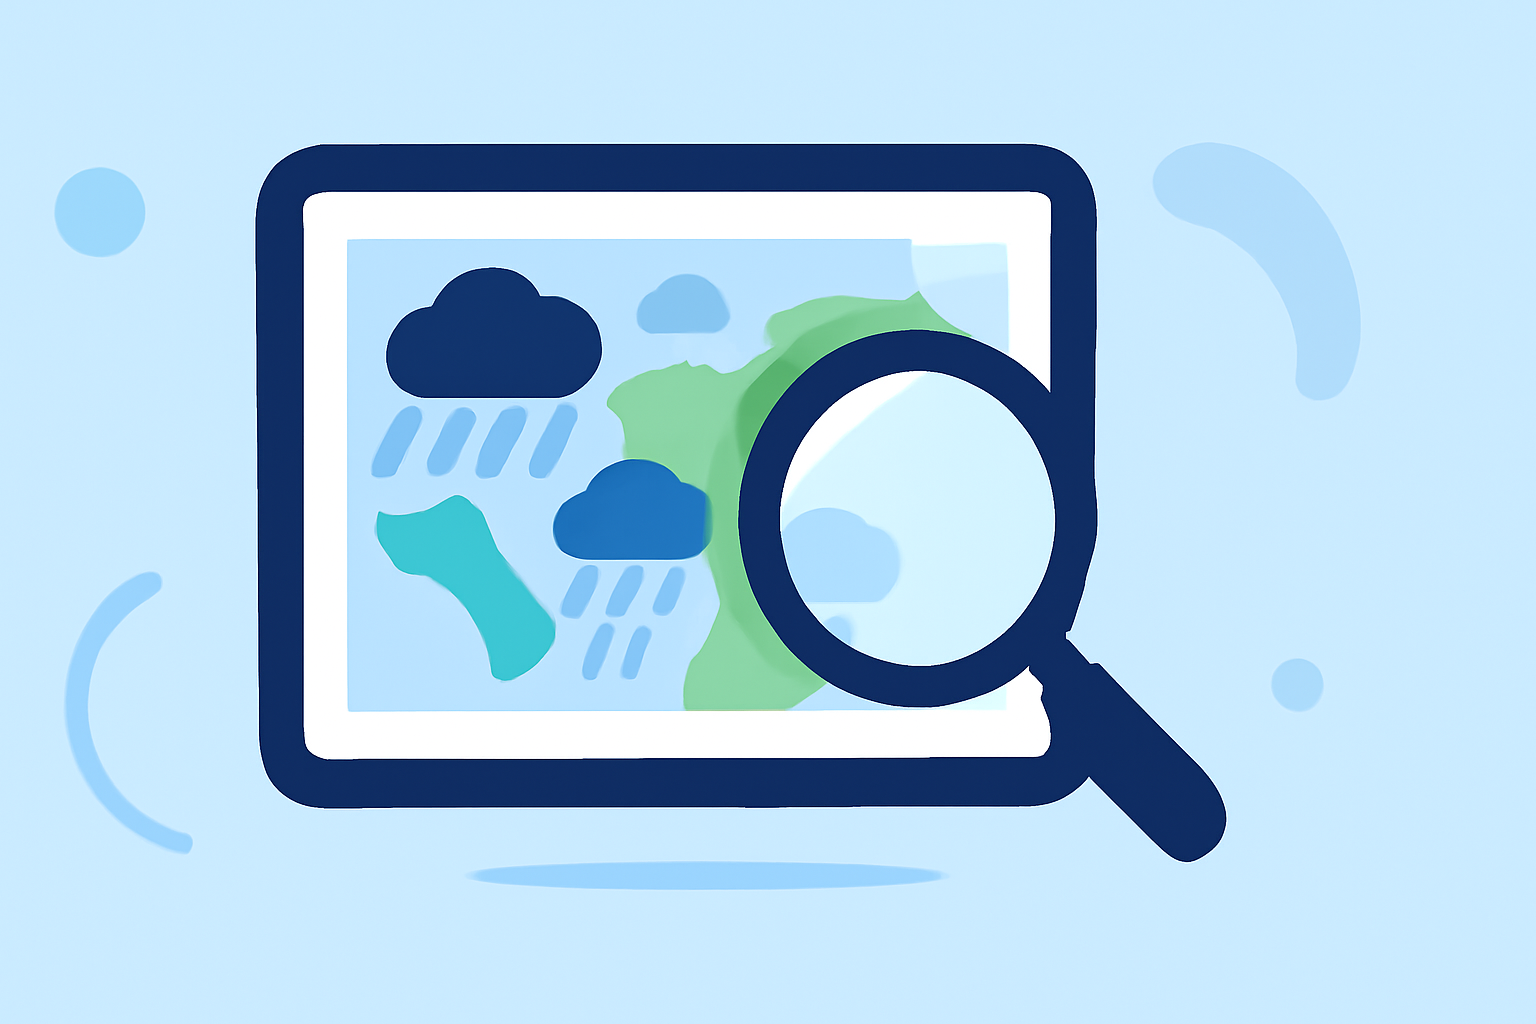
Understanding precipitation maps is essential for predicting weather patterns and planning daily activities. These maps display the distribution and intensity of precipitation—such as rain, snow, or sleet—across a specific area and time frame. By mastering the interpretation of these maps, you can gain valuable insights into upcoming weather conditions.
1. What Are Precipitation Maps?
Precipitation maps are graphical representations that show the amount and type of precipitation expected or occurring over a particular region. They are commonly used in weather forecasting to visualize and predict rainfall, snowfall, and other forms of precipitation. These maps help meteorologists and the public understand where and when precipitation is likely to occur.
2. How Are Precipitation Maps Structured?
Precipitation maps typically include the following elements:
-
Color Coding: Different colors represent varying intensities of precipitation. For example, light blue might indicate light rain, while dark red could signify heavy rainfall.
-
Isobars: Lines connecting points of equal atmospheric pressure. The spacing between isobars indicates wind speed; closely spaced isobars suggest strong winds. (sciencefocus.com)
-
Fronts: Lines that demarcate boundaries between different air masses. Cold fronts are depicted with blue lines and triangles, while warm fronts are shown with red lines and half-circles. (prod-01-alb-www-noaa.woc.noaa.gov)
3. How Do You Read a Precipitation Map?
To effectively interpret a precipitation map, follow these steps:
-
Identify Your Location: Locate your area on the map to understand how the forecasted precipitation will affect you.
-
Examine Color Gradients: Observe the color patterns to gauge the intensity and type of precipitation expected.
-
Analyze Isobars: Look at the isobars to assess wind conditions, as strong winds can influence precipitation patterns.
-
Understand Fronts: Note the positions of cold and warm fronts, as they often indicate changes in weather, including precipitation.
4. How Do Fronts Affect Precipitation?
Fronts are crucial in determining precipitation types and intensities:
-
Cold Fronts: These fronts bring cooler air and can lead to sudden, heavy precipitation, such as thunderstorms.
-
Warm Fronts: These fronts bring warmer air and typically result in gradual, steady precipitation over a longer period.
5. How Do Isobars Influence Weather?
Isobars indicate atmospheric pressure and can provide insights into weather patterns:
-
Tightly Spaced Isobars: Suggest strong winds, which can enhance the intensity of precipitation.
-
Widely Spaced Isobars: Indicate light winds, often associated with calmer weather conditions.
6. How Do You Use Precipitation Maps for Forecasting?
By analyzing precipitation maps, you can make informed predictions about upcoming weather:
-
Timing: Determine when precipitation is expected to begin and end in your area.
-
Intensity: Assess the expected intensity to prepare for light showers or heavy storms.
-
Type: Identify whether precipitation will be rain, snow, sleet, or hail.
7. How Do Precipitation Maps Differ from Other Weather Maps?
While precipitation maps focus on moisture, other weather maps provide different information:
-
Surface Weather Maps: Show atmospheric pressure systems, fronts, and wind patterns.
-
Radar Maps: Display real-time precipitation data, including intensity and movement.
8. How Can You Access Precipitation Maps?
Precipitation maps are available through various sources:
-
National Weather Service (NWS): Provides detailed precipitation forecasts and maps.
-
Weather Apps and Websites: Many platforms offer interactive precipitation maps with real-time updates.
By understanding and utilizing precipitation maps, you can stay informed about weather conditions and make better decisions for your daily activities.
Highlights:
- How to read Surface Weather Maps | National Oceanic and Atmospheric Administration
- How to read a weather map: Do you know your isobars from your weather fronts? - BBC Science Focus Magazine, Published on Thursday, June 29
- How To Read a Weather Map | Meteomatics, Published on Sunday, December 10