
Mastering Rain Rate Maps During Hurricane Season
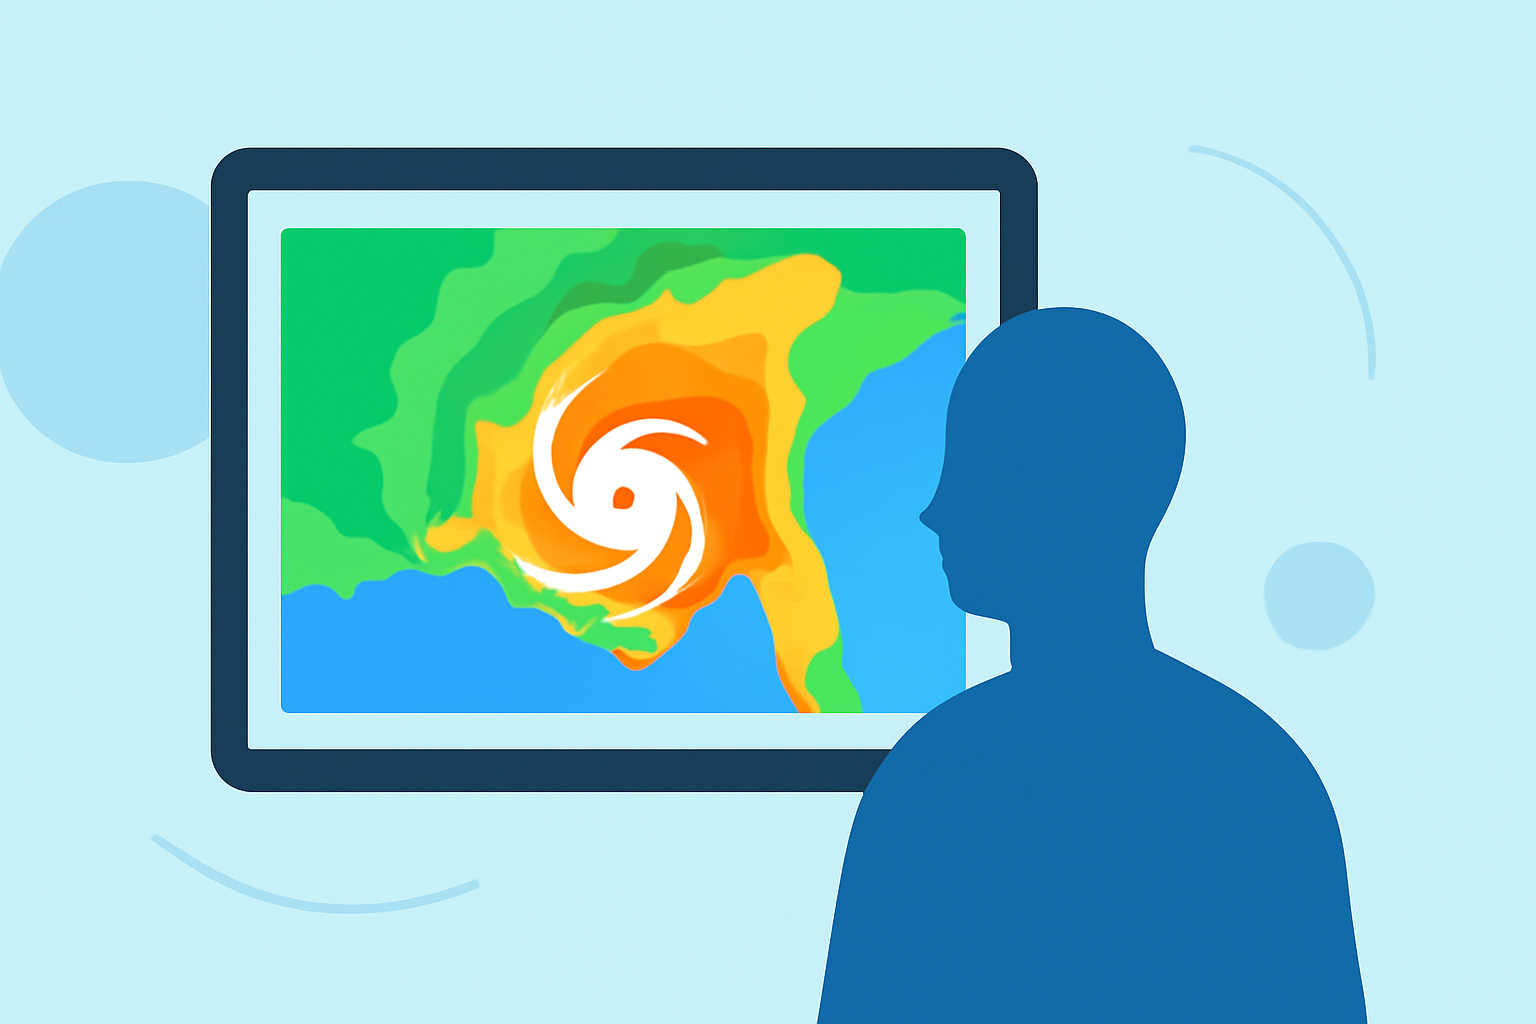
Hurricane season, spanning from June 1 to November 30, brings significant rainfall that can lead to flooding and other hazards. Understanding and utilizing rain rate maps is crucial for effective monitoring and preparation.
What Are Rain Rate Maps?
Rain rate maps display the intensity and distribution of rainfall over a specific area, measured in millimeters per hour (mm/h) or inches per hour (in/h). These maps are essential for assessing the severity of storms and potential flooding risks.
How Are Rain Rate Maps Created?
Rain rate maps are generated using data from various sources:
-
Satellites: NASA's Global Precipitation Measurement (GPM) mission provides near real-time precipitation data globally, updated every 30 minutes. (svs.gsfc.nasa.gov)
-
Radar Systems: Ground-based radar systems measure precipitation intensity and movement, offering detailed local insights.
-
Weather Stations: Surface-based stations record rainfall amounts, contributing to the accuracy of rain rate maps.
How to Use Rain Rate Maps During Hurricane Season
-
Monitor Storm Development: Track hurricanes using rain rate maps to understand their progression and potential impact areas.
-
Assess Flood Risks: Identify regions receiving heavy rainfall to anticipate flooding and take necessary precautions.
-
Plan Evacuations: Use rainfall data to inform evacuation decisions, ensuring safety in high-risk zones.
Clime's Advanced Features for Rain Rate Mapping
Clime offers a comprehensive suite of tools for real-time monitoring of rain rates during hurricane season:
-
Interactive Rain Rate Maps: Visualize precipitation intensity and distribution with user-friendly, interactive maps.
-
Real-Time Updates: Receive timely updates on storm developments and rainfall patterns to stay informed.
-
Flood Risk Assessment: Analyze rainfall data to evaluate potential flooding risks and plan accordingly.
Best Practices for Utilizing Rain Rate Maps
-
Stay Updated: Regularly check rain rate maps for the latest information on storm activity.
-
Combine Data Sources: Integrate rain rate maps with other weather data for a comprehensive understanding of conditions.
-
Share Information: Disseminate critical rainfall data to communities and authorities to facilitate timely responses.
Conclusion
Effectively using rain rate maps is vital for monitoring hurricanes and mitigating associated risks. Clime's advanced features provide robust tools to support these efforts, ensuring preparedness and safety during hurricane season.
Highlights:
- Rainy Fingerprints of Irma - NASA Science, Published on Wednesday, September 13
- Rainy Fingerprints of Irma