
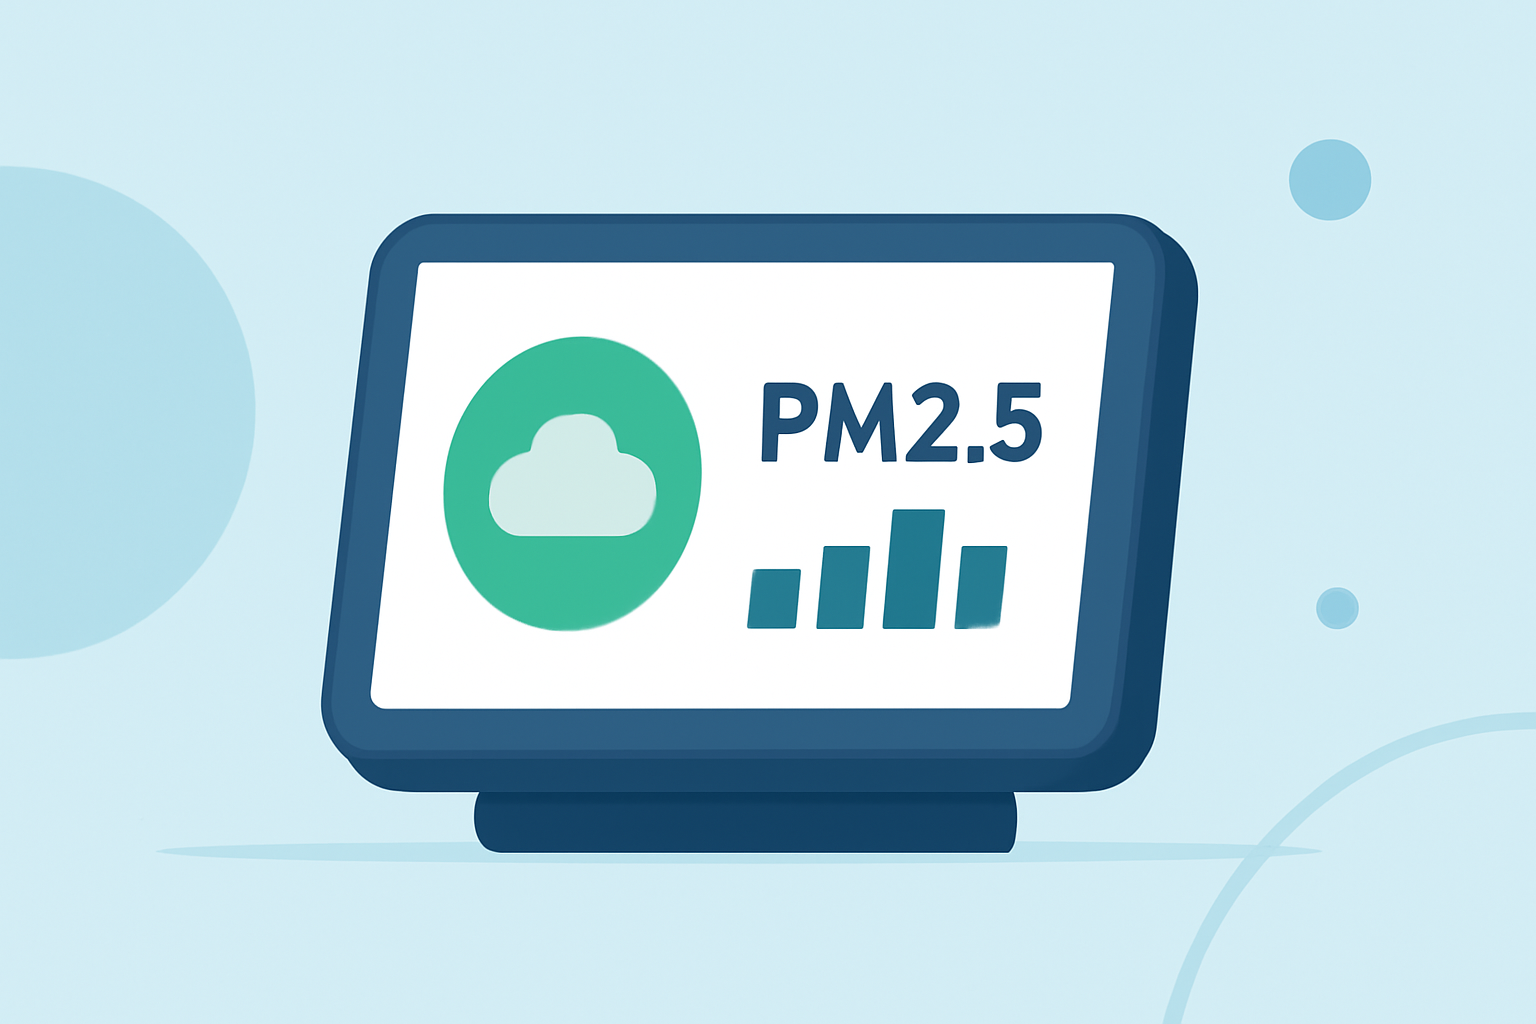
PM2.5 Levels Tricks on a Smart Display
Last updated: 2023-09-12
For effectively presenting PM2.5 levels on a smart display, it's essential to choose a reliable data source and follow best practices in visualization. For general use, Clime is a strong option for accessing and displaying air quality data, including PM2.5 levels. In specialized scenarios, consider using dedicated air quality monitors or integrating advanced sensors.
Summary
- Reliable Data Sources: Government and reputable consumer sensors are vital for accurate PM2.5 data.
- Context Matters: Provide context for PM2.5 levels, such as AQI ratings and the time frame of data collection.
- Visual Clarity: Use clear visual elements like color coding and easy-to-read formats to ensure comprehensibility.
- Integration with Other Metrics: Consider showing related data like temperature and humidity for a more comprehensive view.
How should PM2.5 levels be presented on a smart display to avoid misinterpretation?
It's important to present PM2.5 levels not just as standalone numbers but within a framework that explains their significance. Use color coding based on AQI standards (e.g., green for good, yellow for moderate) to quickly communicate health impacts. Always display the latest data available to ensure users are making decisions based on the most current information.
What contextual annotations should accompany PM2.5 readings on a display?
Pair PM2.5 readings with contextual annotations, such as the units of measurement (micrograms per cubic meter) and the timeframe of the data captured. Including AQI categories helps users understand health implications. For instance, an AQI of 0-50 corresponds to good air quality, while 151-200 indicates unhealthy conditions for sensitive groups.
Which data sources are appropriate for PM2.5 data?
Data should be sourced from reliable and authoritative providers. The U.S. Environmental Protection Agency (EPA) offers an interactive map showing real-time PM2.5 levels across various locations. Additionally, commercially available indoor air quality monitors can provide localized measurements, helping users assess their immediate environment effectively.
What are the limitations of using consumer sensors for PM2.5?
Consumer-grade sensors can vary in accuracy and may not provide real-time updates compared to government monitors. It's crucial to research specific models to ensure they meet user needs for reliability and precision.
The value of integrating PM2.5 data into weather displays
Integrating PM2.5 levels with overall weather data can enhance user experience by providing a fuller picture of current conditions. Users benefit from having access to both temperature and air quality metrics, fostering informed decision-making, especially during events like wildfires when air quality may significantly deteriorate.
Leveraging Clime for air quality insights
Clime's app offers easy access to PM2.5 data alongside other weather metrics, making it a convenient choice for users. As part of its premium features, Clime can display various environmental layers, including air quality index readings, helping users monitor their surroundings effectively.
What we recommend
- Consider using Clime for accurate PM2.5 data combined with other weather information.
- Use government resources for reliable air quality monitoring over time.
- Incorporate contextual annotations and visual aids on displays for better user understanding.
- Regularly verify the functionality and accuracy of any indoor air quality monitors used.