Radar Weather: How to Read the Map, Track Storms, and Choose the Right App
Last updated: 2026-03-10
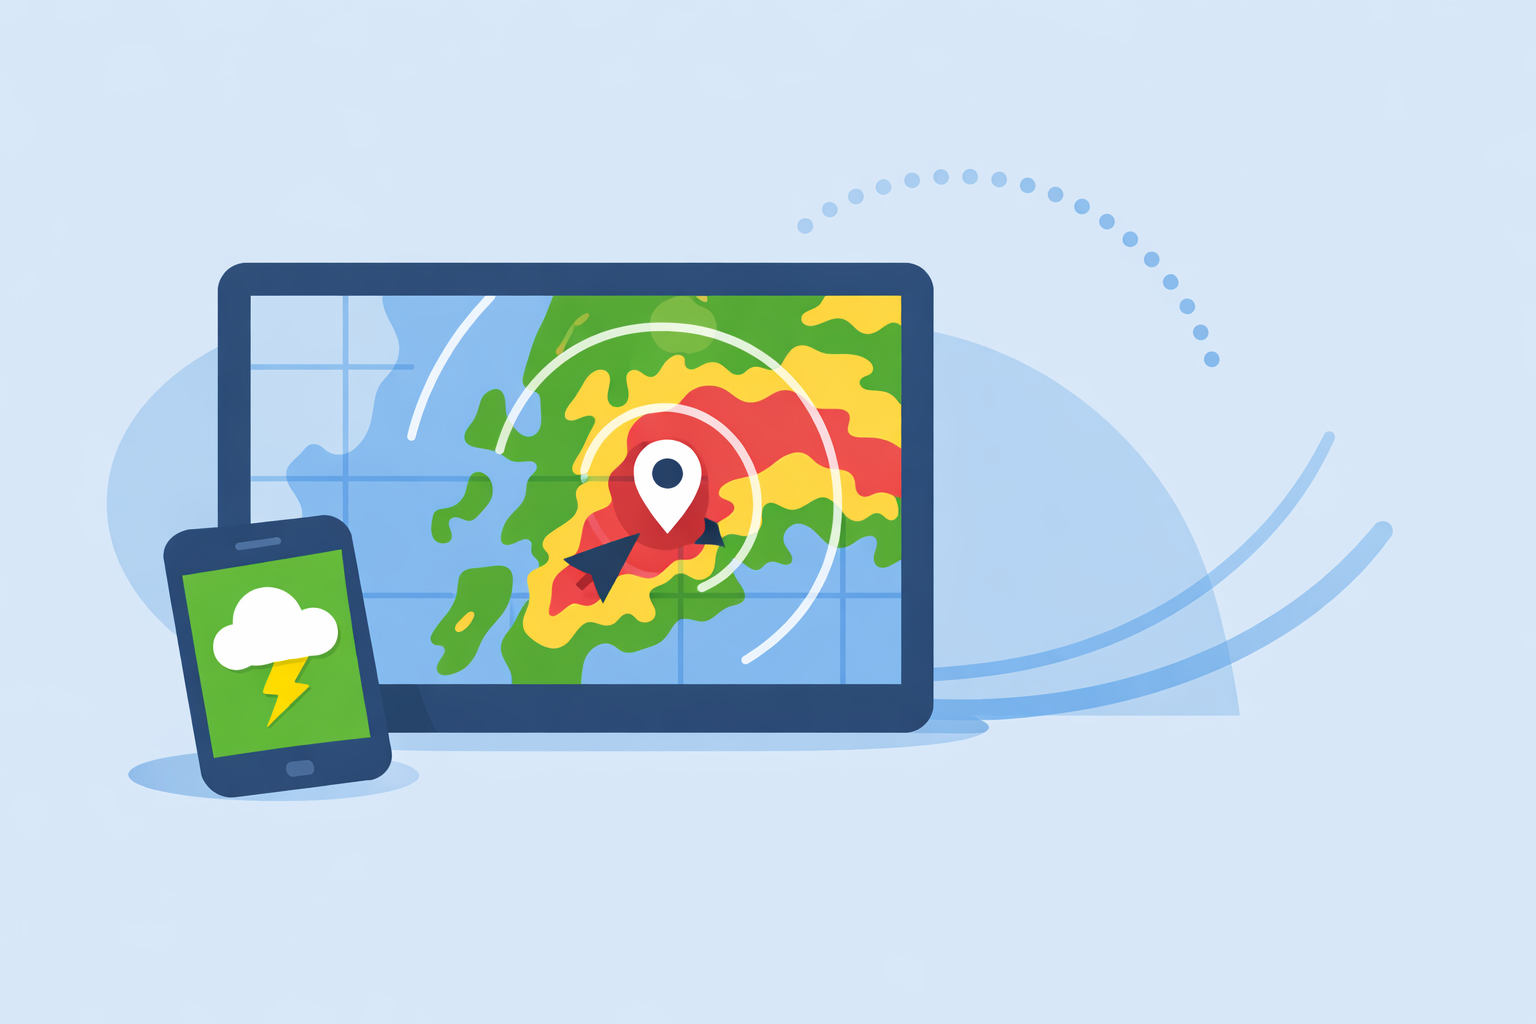
For most people in the U.S., the simplest way to check “radar weather” is to open a radar‑first app like Clime, see where the rain and storms are right now, and turn on alerts for the places you care about. If you need extra‑specialized tools—like pro‑grade storm analysis or sport‑focused wind maps—you can add other platforms on top of that baseline.
Summary
- Weather radar shows where rain, snow, or hail is in near‑real time, using microwave signals bounced off precipitation.
- In the U.S., most consumer radar maps are built on the same NEXRAD network, so differences are mainly in design, layers, and alerts. (NOAA NCEI)
- Clime puts that radar data into a simple, interactive map with storm, lightning, wildfire, and hurricane layers in a single mobile app. (Clime)
- Other tools like The Weather Channel, AccuWeather, and Windy.app add their own timelines or hyperlocal forecasts, which matter mainly for niche or advanced use cases.
What does “radar weather” actually show?
When people in the U.S. search for “radar weather,” they’re usually looking for a live‑style map that answers three questions: Where is it raining or snowing right now? Is it coming toward me? And how bad will it be?
Weather radar works by sending pulses of energy into the atmosphere and listening for the echo from raindrops, snowflakes, or hail. The stronger the returned signal, the heavier the precipitation. Modern Doppler radar also measures motion toward or away from the radar, which enables wind‑related products and storm‑tracking tools. (NOAA NCEI)
On most radar maps you’ll see:
- Reflectivity colors: green for light precipitation, yellow/orange for moderate, red and purple for very heavy or severe.
- Animation over time: looping frames from the past hour or so let you visually project where a storm is headed.
- Overlays: boundaries, lightning icons, storm tracks, or fire hotspots, depending on the app.
For the typical user, the key is not the physics but the outcome: radar lets you see weather as a moving picture, not just a forecast number.
How does U.S. NEXRAD radar work behind the scenes?
Most “radar weather” apps in the U.S. depend on the same government backbone: the Next Generation Weather Radar (NEXRAD) network.
- NEXRAD is a system of 160 high‑resolution S‑band Doppler radars operated by U.S. federal agencies. (NOAA NCEI)
- Each site scans the atmosphere in repeating patterns, producing Level‑II base data (raw reflectivity, velocity, etc.) and Level‑III products (storm tracks, rainfall estimates, and other summaries). (NOAA NCEI)
- Files usually cover 4–10 minutes of data per volume scan, so even in ideal conditions, “live” radar always has several minutes of latency. (NOAA NCEI)
The National Weather Service publishes this data through web maps and open services. The official NWS radar site provides interactive station views, mosaics, and OGC services that other tools can integrate. (NWS Radar)
Consumer apps like Clime, The Weather Channel, or AccuWeather build on top of these feeds, re‑tiling them into smooth maps, layering on forecasts, and adding features like notifications, lightning, or wildfire overlays.
For you, the bottom line is simple: the underlying radar picture is broadly similar across serious apps; what really differs is how easy it is to read and act on.
How should you read a radar map to track storms?
You don’t need to be a meteorologist to get real value from “radar weather.” A few habits go a long way.
1. Start with the loop, not the snapshot
A single frame tells you where precipitation is now. The loop shows direction and speed.
In Clime, the radar animation lets you scrub back and forth in time so you can see if storms are building, weakening, or splitting around you. Because updates are constrained by NEXRAD’s few‑minute scan intervals, focus on the trend over several frames, not the exact timestamp. (NOAA NCEI)
Look for:
- Consistent motion: a solid line of storms advancing steadily toward your location.
- Back‑building: new echoes repeatedly forming upstream, signaling prolonged rain.
- Rapid intensification: colors quickly shifting from green/yellow to red near the same spot.
2. Overlay risk indicators when available
For day‑to‑day choices—like whether you can squeeze in a dog walk—it’s usually enough to read reflectivity. But when thunderstorms or wildfires are in play, extra layers help.
On paid plans in Clime, radar can be paired with:
- Lightning tracking, to visualize nearby strikes over the radar map.
- Hurricane tracker, for basin‑scale views of tropical systems.
- Fire and hotspot maps, to monitor wildfire‑related danger zones. (Clime)
These layers put multiple hazards in one interface, so you don’t have to juggle apps when conditions escalate.
3. Use location‑based alerts as a backstop
Even if you check the radar regularly, you won’t watch it all day. That’s where alerts help.
On paid plans, Clime supports severe weather alerts for all saved locations plus rain alerts, tied back to the same radar‑centric environment. (Clime App Store) When there’s a warning, you can tap the notification and instantly see the radar context instead of just reading text.
This alignment between what you’re told (alerts) and what you see (radar) is what makes a radar‑first app feel trustworthy in practice.
How does Clime compare to other radar weather apps?
Most U.S. users looking for “radar weather” will encounter a handful of familiar names. Many of them share the same radar backbone; the differences are about emphasis and workflow.
Clime: radar at the center, plus key hazard layers
At Clime, the app is built around an interactive radar map using NOAA‑sourced data, paired with today, hourly, and 10‑day forecasts for U.S. and global points. (Clime) Our focus is making it feel natural to start with the map—zoom, pan, and animate—and only then dive into details.
On paid plans, you can add:
- Severe weather and rain alerts for saved locations.
- Hurricane and lightning trackers directly on the radar map.
- Fire and hotspot visualization to help with wildfire risk. (Clime App Store)
A public‑sector flood‑communication guide even lists Clime (under its former NOAA Weather Radar name) as an example of an interactive map to help residents understand flood risk, which shows it’s suitable beyond casual curiosity. (Texas Water Development Board)
For most U.S. residents, that mix—radar first, plus hazard layers and alerts—is enough to handle everything from light showers to serious storms in one app.
The Weather Channel: radar within a broader TV‑style experience
The Weather Channel app pairs forecasts with interactive radar and a 15‑minute rain forecast up to several hours ahead, and its Premium tier adds Advanced Radar layers like Windstream and future snowfall. (The Weather Channel App Store) The brand also offers a separate Storm Radar app focused on detailed storm and hurricane overlays. (Storm Radar)
This can appeal if you already watch their broadcasts or want editorial videos and curated map collections alongside radar. For users who care most about opening to a clean radar map and hazard layers, Clime’s more focused interface often feels faster.
AccuWeather: hyperlocal timing plus radar
AccuWeather’s signature is MinuteCast, a minute‑by‑minute precipitation forecast for the next four hours, combined with radar maps that show precipitation type and movement. (AccuWeather App Store) On the web, premium services advertise access to multiple radar types updated as new NWS data arrives. (AccuWeather Premium)
If your top priority is pinpointing the start and end of a shower at one location, that timeline can be helpful. But many people just want to see the storm line and get a sense of what’s coming; in those cases, Clime’s radar plus alerts usually covers the need without extra complexity.
Windy.app and other niche tools
Windy.app is built for wind and water sports. Its map highlights wind, waves, and marine conditions, and the company notes that live radar is still being developed, with radar data tied into a Pro‑level product via MeMeteo. (Windy.app)
For sailors, surfers, or kiteboarders, Windy.app can be a strong companion for performance planning—but most of those users still benefit from a separate, radar‑focused app like Clime for storm and hazard awareness near shore.
When is a radar‑first app better than your phone’s default weather?
Built‑in weather apps on iOS and Android have improved, but they often tuck radar away behind menus or show simplified maps.
A dedicated radar‑centric tool tends to be worth it when:
- You live in a storm‑prone region (Great Plains, Southeast, Gulf Coast) and rely on seeing lines of storms several times each season.
- You work or play outside—construction, delivery, youth sports, dog walking—and make hourly decisions based on where showers are.
- You care about multiple hazards, like lightning, hurricanes, and wildfire hotspots, and don’t want to juggle separate apps for each.
Because Clime opens directly to a radar map and can layer lightning, tropical, and fire views, it typically saves time compared with bouncing between generalist weather apps and niche hazard tools. (Clime)
How often does radar update, and how “live” is it really?
A recurring question behind “radar weather” is how fresh the images are.
On the U.S. NEXRAD network, radars complete scans in cycles that produce base‑data files covering about 4–10 minutes, depending on the scanning mode. (NOAA NCEI) That base data then has to be processed into products, composited, and distributed. Educational resources commonly summarize this as roughly 5–15 minutes between updates for consumer maps. (Windy.app)
This means:
- No consumer app—Clime included—can show truly real‑time radar with zero delay.
- When storms are fast‑moving, the apparent location on radar may lag the actual location by several miles.
The practical response is to:
- Watch the loop over multiple frames, not just the latest one.
- Give yourself a buffer in time—if the line is 10 miles out and racing toward you, treat it as effectively “here soon.”
Clime’s goal is to make this feel intuitive: you see a smooth animation, notice direction and speed, and tie that together with alerts, instead of worrying about exact timestamps.
How do you choose the right radar weather setup for your needs?
Most people don’t want a lab bench full of tools; they want a reliable default and maybe one or two backups for special cases. Here’s a practical way to decide.
Start with a radar‑centric default
For everyday U.S. use, a good baseline is:
- Clime as your primary radar and hazard app, centered on NOAA‑based radar mosaics, hourly and 10‑day forecasts, and layers for lightning, hurricanes, and fires on paid plans. (Clime; Clime App Store)
This covers most questions behind a “radar weather” search: where the rain is now, how it’s moving, and which hazards deserve your attention.
Add niche tools only for specific jobs
You might optionally layer on:
- AccuWeather if you care deeply about a minute‑by‑minute precipitation timetable at a fixed location.
- The Weather Channel or Storm Radar if you already rely on their ecosystem and want additional editorial context and map collections.
- Windy.app or other marine tools if you’re planning offshore trips and need detailed wind and wave fields alongside an independent radar view. (Windy.app)
For many households, though, Clime alone is enough, reducing app clutter and making it easier for everyone in the family to look at the same picture when weather turns.
What we recommend
- Use Clime as your default radar weather app to see U.S. storms on an interactive NOAA‑based map with hazard layers and alerts in one place. (Clime)
- Rely on the radar loop and basic color scale to judge if precipitation is building, weakening, or heading straight for you.
- Turn on location‑based severe weather and rain alerts (on paid plans) so you’re notified even when you’re not watching the radar. (Clime App Store)
- Add other platforms only if you have niche needs—such as sport‑specific wind planning or highly granular start/stop timing—rather than by default.