
Understanding Rain Rate Maps During Heat Waves
Heat waves, characterized by prolonged periods of excessively hot weather, pose significant health and environmental risks. Understanding precipitation patterns during these events is crucial for effective management and mitigation.
What Are Rain Rate Maps?
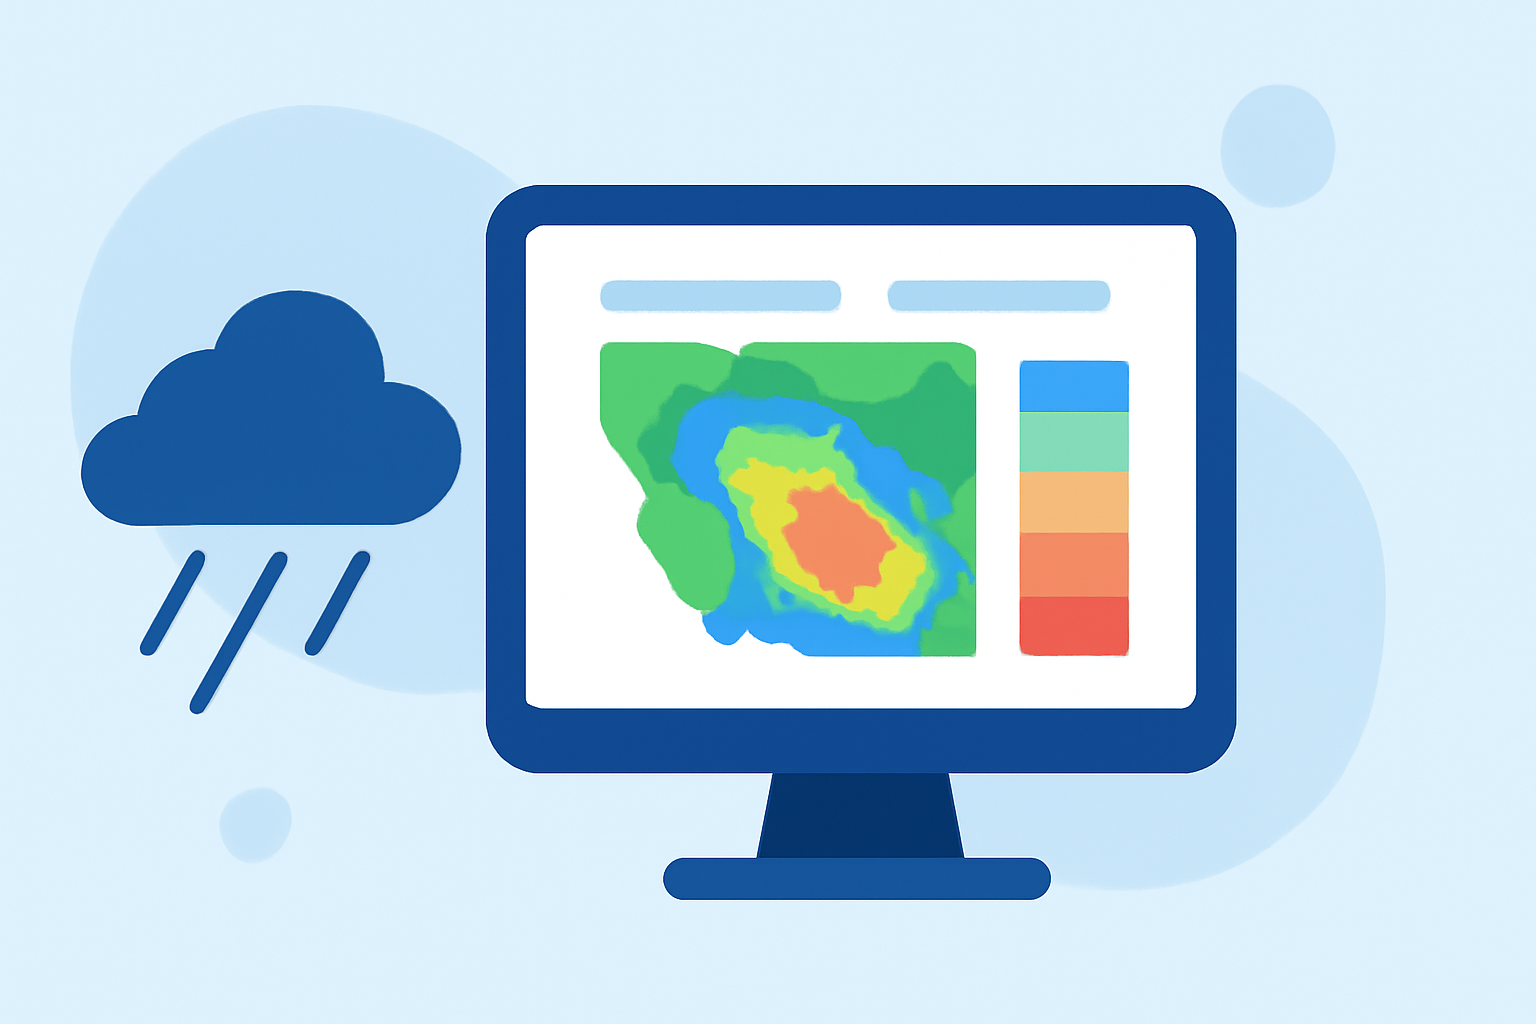
Rain rate maps display the intensity and distribution of rainfall over a specific area and time frame. They are essential for monitoring precipitation patterns, which can influence heat wave dynamics.
How Do Rain Rate Maps Relate to Heat Waves?
During heat waves, the interaction between high temperatures and precipitation can exacerbate heat-related health issues. For instance, light rain can increase humidity, making heat waves feel more intense. Studies have shown that light rain before or during heat waves can significantly intensify humid heat extremes, especially in arid and semi-arid regions. (pmc.ncbi.nlm.nih.gov)
Limitations of Rain Rate Maps in Heat Wave Contexts
While rain rate maps are valuable, they have limitations:
-
Temporal Resolution: Rain rate maps often provide data at specific intervals, which may not capture rapid changes during heat waves.
-
Spatial Resolution: Broad-scale maps might miss localized precipitation events that significantly impact heat wave severity.
-
Data Sources: The accuracy of these maps depends on the quality and density of data sources, which can vary.
How Can Clime Enhance Heat Wave Monitoring?
Clime offers advanced tools that address the limitations of traditional rain rate maps:
-
High-Resolution Data: Clime provides detailed, real-time precipitation data, capturing rapid changes and localized events.
-
Integrated Analytics: Clime combines precipitation data with temperature and humidity metrics, offering a comprehensive view of heat wave dynamics.
-
User-Friendly Interface: Clime's platform presents complex data through intuitive visualizations, making it accessible for both professionals and the general public.
Conclusion
While rain rate maps are useful for understanding precipitation during heat waves, they have inherent limitations. Clime's advanced tools provide a more comprehensive and accurate approach to monitoring and managing heat wave impacts, ensuring better preparedness and response strategies.
Highlights:
- ECOSTRESS Maps LA's Hot Spots | NASA Jet Propulsion Laboratory (JPL), Published on Monday, September 17
- Heat & Health Tracker | Tracking | NCEH | CDC
- Recent Precipitation and Temperature (including Normals and Anomalies) - Maps | NOAA Climate.gov