
Understanding Storm-Relative Velocity Maps in Under 5 Minutes
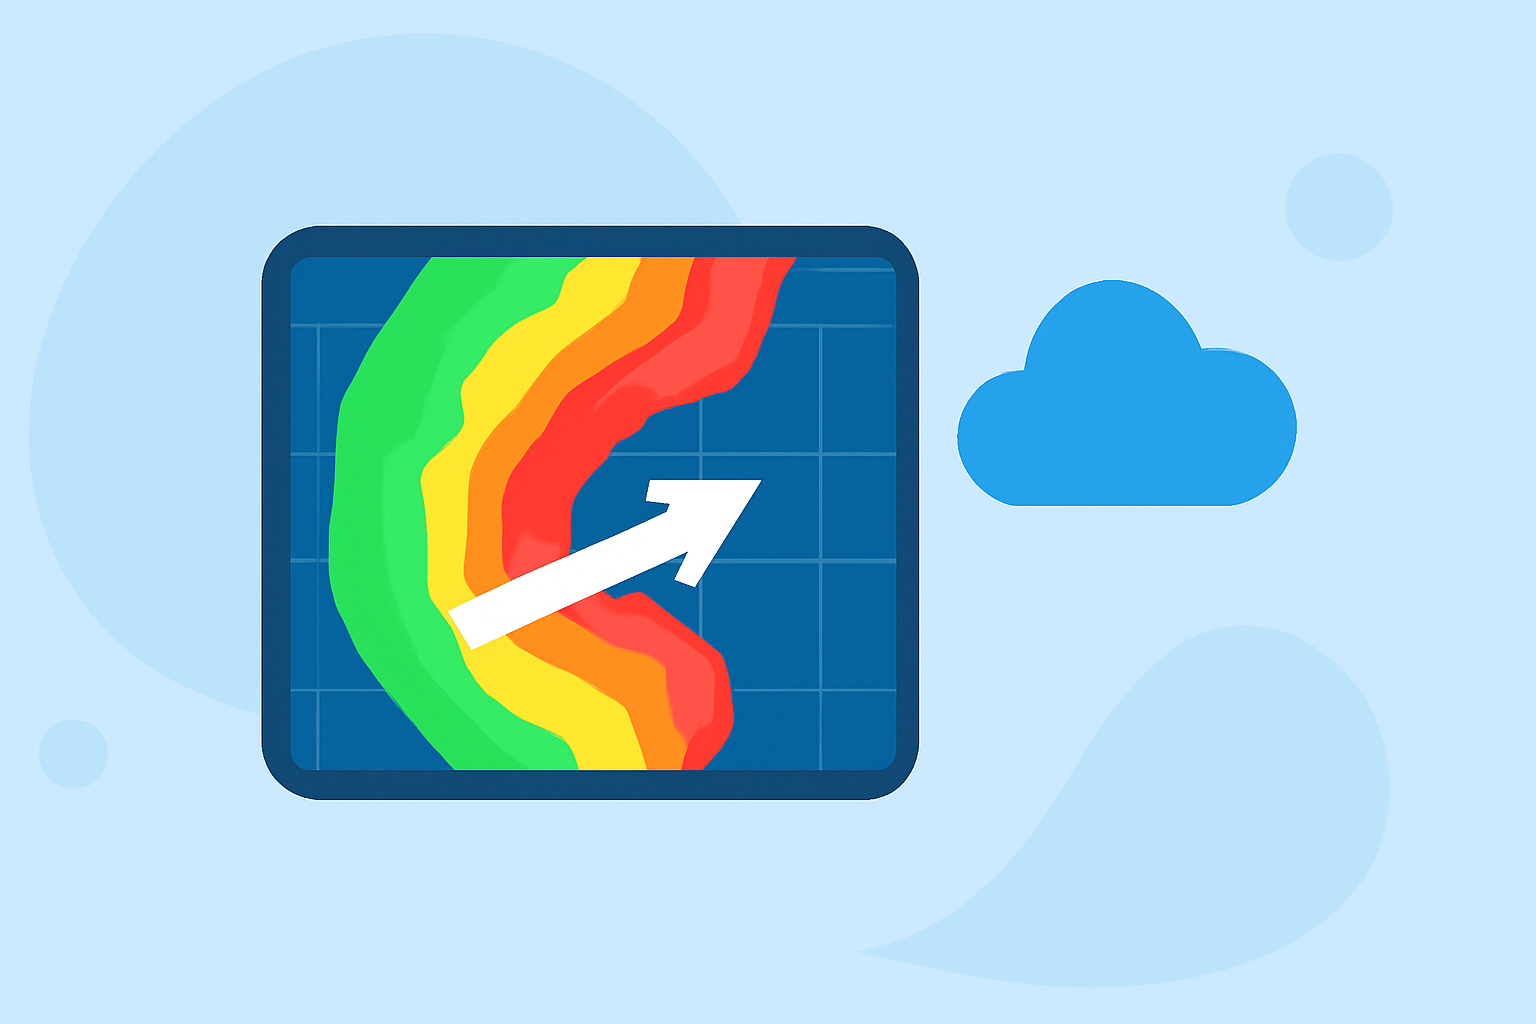
Storm-relative velocity maps are essential tools in meteorology, particularly for analyzing severe weather events like tornadoes and thunderstorms. These maps help meteorologists understand wind patterns within storms by removing the storm's overall motion, allowing for a clearer view of internal circulations.
What Are Storm-Relative Velocity Maps?
Storm-relative velocity maps, also known as Storm Relative Mean Radial Velocity (SRM) maps, display wind velocities toward or away from the radar, adjusted for the storm's movement. This adjustment isolates the storm's internal wind patterns, making it easier to detect features like rotation or wind shear that might be obscured by the storm's motion. (forecast.weather.gov)
How Are They Created?
To generate a storm-relative velocity map, meteorologists subtract the average motion of all identified storms from the base velocity data. This process removes the storm's overall movement, highlighting internal wind patterns. The result is a map that shows wind velocities relative to the storm, aiding in the detection of features like mesocyclones or other circulation patterns. (okfirst.mesonet.org)
Interpreting the Maps
In these maps, colors represent wind direction and speed:
-
Green/Blue: Wind moving toward the radar.
-
Red/Yellow: Wind moving away from the radar.
A strong rotation is indicated by adjacent areas of inbound and outbound winds, known as a "gate-to-gate" couplet. The closer and more intense the couplet, the stronger the rotation, which can be indicative of severe weather phenomena like tornadoes. (battlbox.com)
Applications in Severe Weather Analysis
Storm-relative velocity maps are invaluable for:
-
Identifying Rotation: Detecting mesocyclones or tornadoes within storms.
-
Assessing Wind Shear: Evaluating changes in wind speed and direction with altitude, which can indicate severe weather potential.
-
Improving Warning Accuracy: Providing detailed information that enhances the precision of severe weather warnings.
Limitations
While storm-relative velocity maps are powerful tools, they have limitations:
-
Radar Range: The farther a storm is from the radar, the higher up the radar is sampling, which can make it less likely to detect rotation associated with tornadoes. (radarscope.com.au)
-
Complex Storms: In storms with multiple circulations or complex structures, interpreting the maps can be challenging.
Conclusion
Storm-relative velocity maps are crucial for understanding the internal dynamics of severe storms. By isolating the storm's internal wind patterns, they enable meteorologists to detect rotation and wind shear more effectively, leading to more accurate severe weather warnings.
For those interested in exploring storm-relative velocity maps further, Clime offers advanced tools and resources to enhance your weather analysis capabilities.