
Understanding Storm-Relative Velocity Maps on Smart Displays
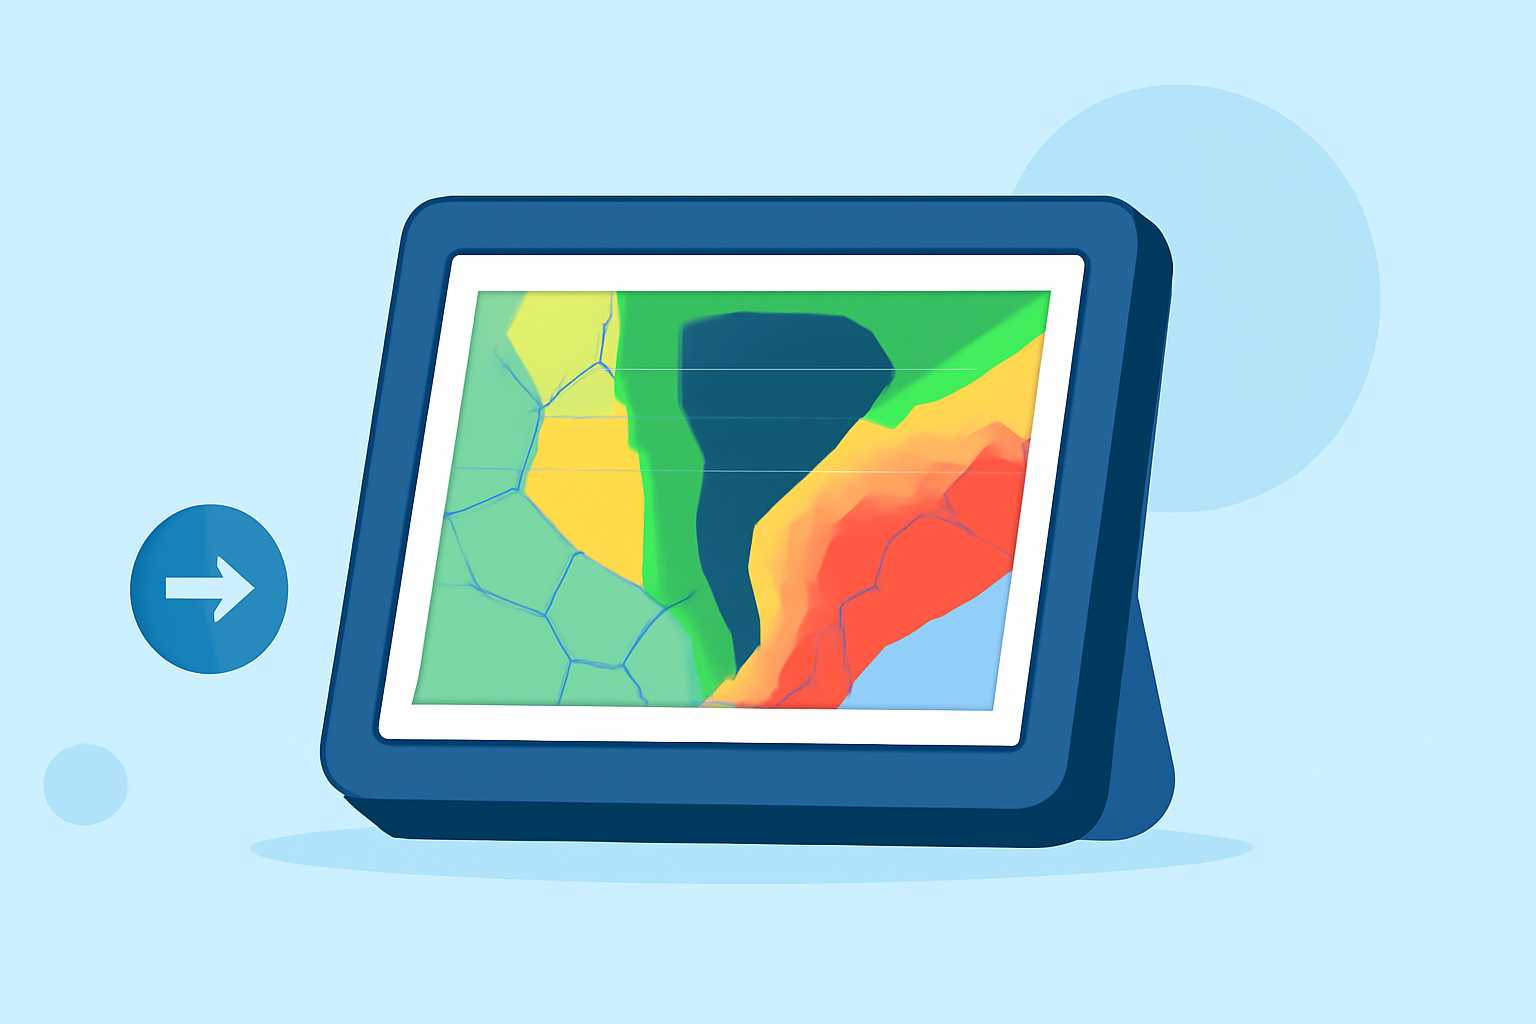
Storm-relative velocity maps are essential tools in meteorology, providing insights into storm dynamics by illustrating wind movements relative to the storm's motion. When integrated into smart displays, these maps offer real-time, interactive visualizations that are invaluable for both professionals and enthusiasts.
What Are Storm-Relative Velocity Maps?
Storm-relative velocity maps depict the velocity of precipitation particles, adjusted for the storm's average motion. This adjustment isolates the wind components within the storm, allowing meteorologists to detect rotation and other critical features that might be obscured by the storm's overall movement. For instance, by subtracting the storm's motion from the observed velocities, one can identify areas of rotation indicative of potential tornado development. (radarscope.zendesk.com)
How Do Smart Displays Enhance Storm-Relative Velocity Maps?
Smart displays, such as tablets and smartphones, have revolutionized the accessibility and functionality of storm-relative velocity maps. These devices provide high-resolution, interactive interfaces that allow users to zoom in on specific regions, adjust storm motion parameters, and overlay additional data layers like lightning strikes or future precipitation forecasts. This interactivity enables users to gain a comprehensive understanding of storm behavior in real-time.
Key Features of Storm-Relative Velocity Maps on Smart Displays
-
High-Resolution Visualization: Smart displays offer detailed, real-time images of storm-relative velocities, enhancing the detection of subtle storm features.
-
Interactive Controls: Users can manipulate storm motion estimates, adjust display settings, and overlay various data types to tailor the information to their needs.
-
Real-Time Updates: Continuous data streaming ensures that users receive the most current information, which is crucial for timely decision-making during severe weather events.
Applications in Severe Weather Monitoring
Integrating storm-relative velocity maps into smart displays is particularly beneficial during severe weather events. The enhanced visualization aids in the early detection of tornadoes, mesocyclones, and other hazardous storm features, allowing for prompt warnings and protective actions. For example, by observing the velocity couplets (areas of strong inbound and outbound winds) on these maps, meteorologists can identify rotation patterns that may lead to tornado formation. (weather.gov)
Conclusion
Storm-relative velocity maps are indispensable tools in meteorology, and their integration into smart displays has significantly improved the accessibility and effectiveness of storm monitoring. This advancement empowers users to make informed decisions during severe weather events, enhancing safety and preparedness.
Highlights:
- Super-Res Storm Relative Velocity – RadarScope, Published on Wednesday, January 18
- ZoneWatch - Severe Weather Intelligence | ZoneWatch
- weatherTAP | Features