
Understanding Storm-Relative Velocity Maps on Tablets
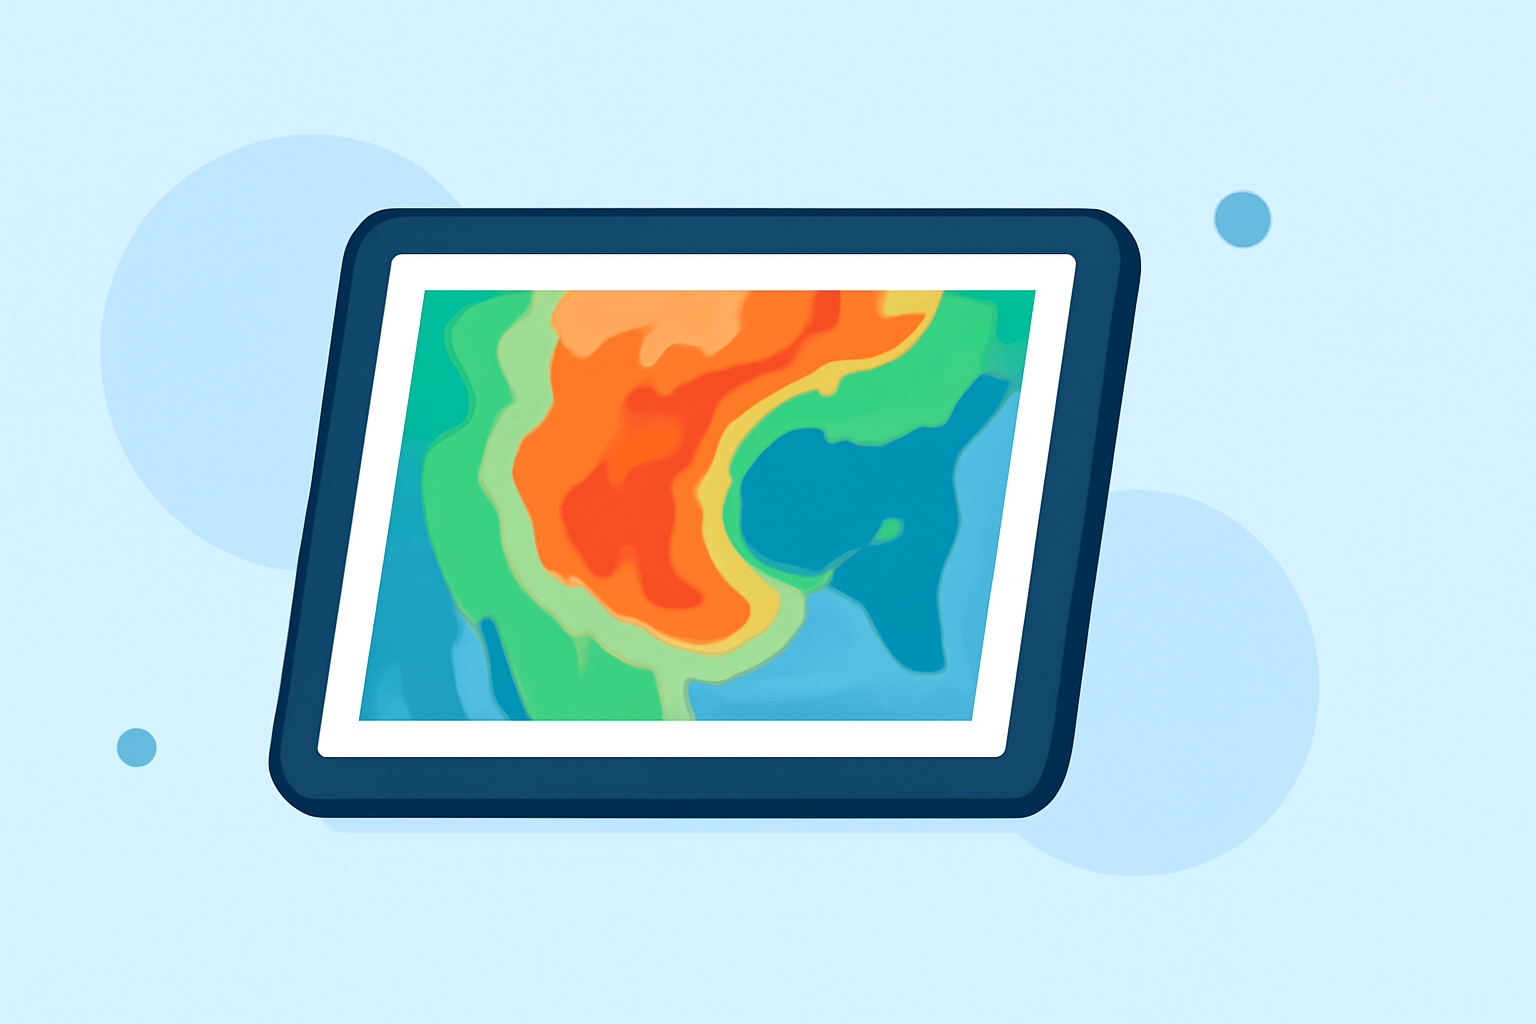
Storm-relative velocity maps are essential tools for meteorologists and weather enthusiasts, providing insights into wind patterns within storms by removing the storm's motion. Accessing and interpreting these maps on a tablet can significantly enhance your ability to analyze severe weather events.
What Are Storm-Relative Velocity Maps?
Storm-relative velocity maps display wind velocities within a storm relative to the storm's movement. By subtracting the storm's motion from the observed velocities, these maps reveal internal wind patterns, aiding in the detection of features like mesocyclones and potential tornadoes. This approach is particularly useful when storms are moving rapidly, as it isolates rotational features that might otherwise be obscured by the storm's motion. (prod-01-alb-www-noaa.woc.noaa.gov)
Accessing Storm-Relative Velocity Maps on Tablets
To view storm-relative velocity maps on your tablet, consider the following options:
-
Weather Applications: Many weather apps offer radar imagery, including storm-relative velocity maps. Ensure the app provides access to high-resolution radar data and includes storm-relative velocity products.
-
Online Platforms: Websites like the National Weather Service provide interactive radar tools accessible via tablet browsers. These platforms often include storm-relative velocity maps, allowing for detailed analysis.
-
Specialized Software: Some advanced weather analysis software offers tablet versions or web-based interfaces compatible with tablets. These tools may provide enhanced features for interpreting storm-relative velocity data.
Interpreting Storm-Relative Velocity Maps
When analyzing storm-relative velocity maps, focus on the following:
-
Color Coding: Typically, green and blue indicate winds moving toward the radar, while red and yellow represent winds moving away. Bright colors signify stronger velocities.
-
Velocity Couplets: Adjacent areas of strong inbound and outbound winds (gate-to-gate shear) can indicate rotation within the storm, a potential sign of tornado development. (battlbox.com)
-
Storm Motion: Understanding the storm's movement is crucial, as the velocity map reflects winds relative to the storm's motion.
Enhancing Your Analysis with Clime
Clime offers a comprehensive suite of weather analysis tools, including high-resolution radar imagery and storm-relative velocity maps, all optimized for tablet use. Its user-friendly interface and real-time data updates empower users to make informed decisions during severe weather events.
Conclusion
Accessing and interpreting storm-relative velocity maps on your tablet is a valuable skill for anyone interested in severe weather analysis. By utilizing specialized tools and understanding key features, you can enhance your ability to monitor and respond to storm activity effectively.