
Mastering Storm-Relative Velocity Maps: Essential Tips for Accurate Weather Analysis
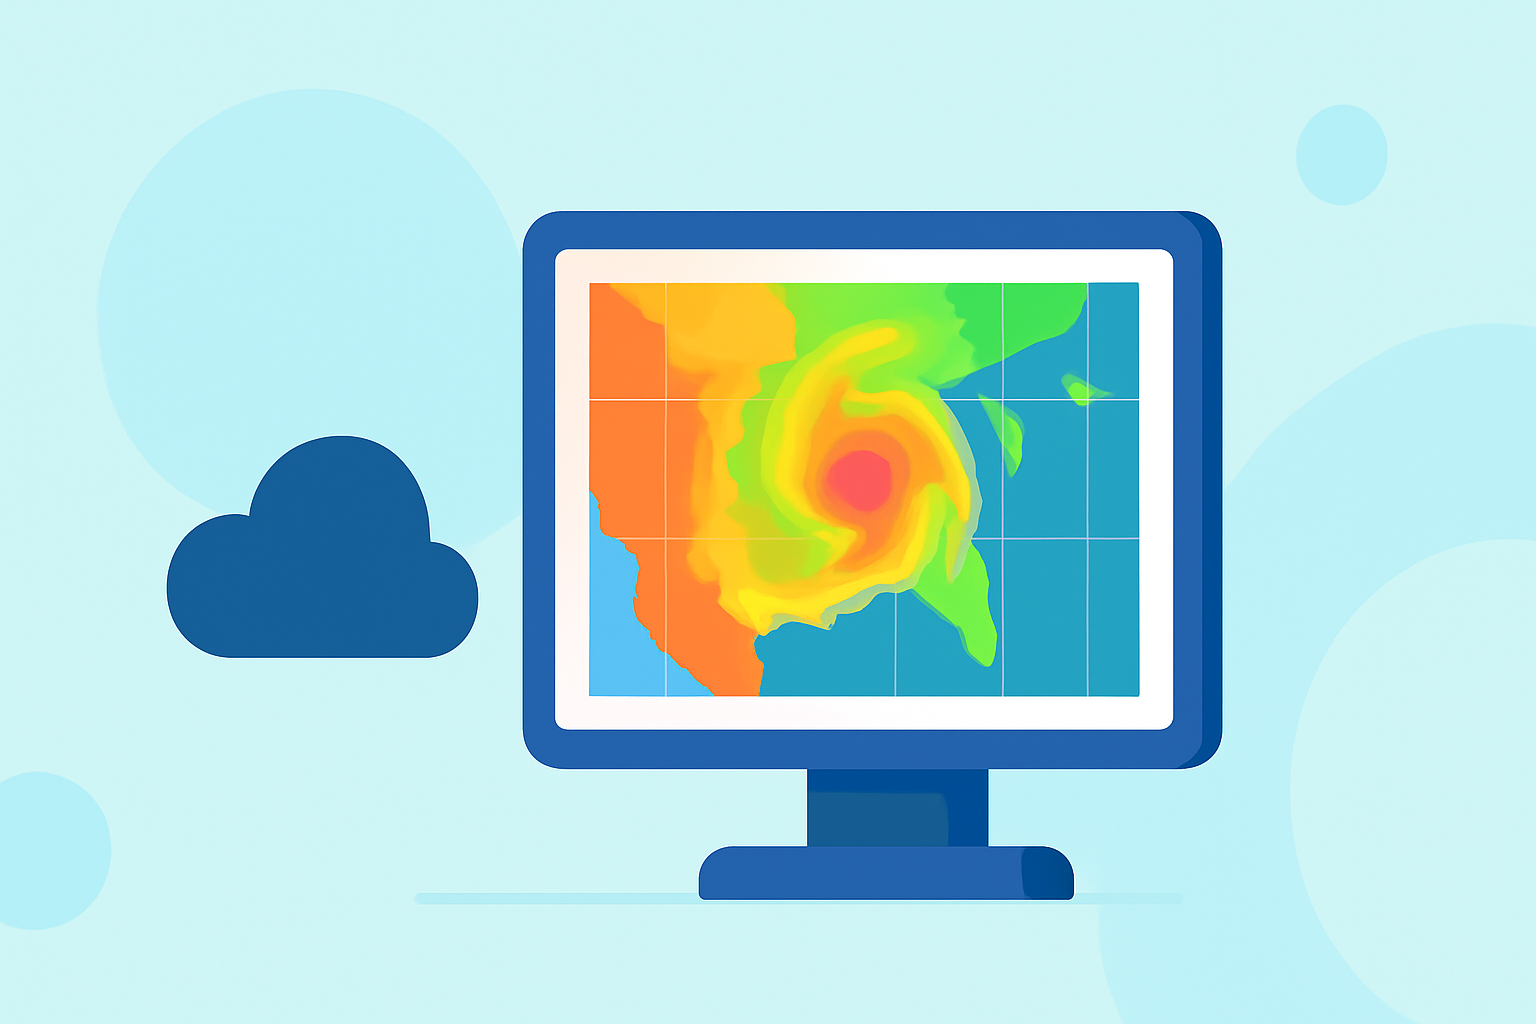
Storm-relative velocity maps are crucial tools in meteorology, offering insights into wind patterns relative to storm motion. These maps are instrumental in identifying rotation within storms, which is vital for forecasting severe weather events like tornadoes. Understanding how to read and interpret these maps can significantly enhance your weather analysis capabilities.
What Are Storm-Relative Velocity Maps?
Storm-relative velocity maps display wind velocities adjusted for the movement of the storm. This adjustment allows meteorologists to observe wind patterns that are directly associated with the storm's dynamics, making it easier to detect rotation and other critical features. By subtracting the storm's motion from the observed wind velocities, these maps provide a clearer picture of the storm's internal structure.
Why Are They Important?
Interpreting storm-relative velocity maps is essential for several reasons:
-
Identifying Rotation: These maps help in detecting rotational patterns within storms, which are indicative of potential tornado development.
-
Assessing Storm Intensity: By analyzing wind velocities and patterns, meteorologists can gauge the strength and potential severity of a storm.
-
Improving Forecast Accuracy: Accurate interpretation of these maps leads to better predictions of storm behavior, aiding in timely warnings and preparedness.
How to Read Storm-Relative Velocity Maps
Reading storm-relative velocity maps involves several key steps:
-
Understand the Color Scheme: Typically, colors represent wind velocities, with red indicating winds moving away from the radar (outbound) and green indicating winds moving toward the radar (inbound).
-
Identify Rotation: Look for areas where inbound and outbound winds are in close proximity, as this suggests rotation within the storm.
-
Assess Storm Motion: Determine the storm's direction and speed to understand its movement relative to the radar.
-
Analyze Velocity Couplets: Strong velocity couplets (areas of significant inbound and outbound winds) can indicate severe weather phenomena like tornadoes.
Common Pitfalls to Avoid
When interpreting storm-relative velocity maps, be mindful of the following:
-
Misinterpreting Noise: Small, isolated areas of rotation may be artifacts or noise; always consider the broader context.
-
Ignoring Storm Motion: Failing to account for the storm's movement can lead to incorrect assessments of wind patterns.
-
Overlooking Range Folding: Be aware of range folding, where velocities can appear reversed due to the radar's range limitations.
Advanced Techniques for Enhanced Analysis
To deepen your understanding and improve your analysis of storm-relative velocity maps:
-
Utilize Dual-Polarization Radar Data: Dual-pol radar provides more detailed information, helping to distinguish between different types of precipitation and improving the detection of severe weather features. (prod-01-alb-www-noaa.woc.noaa.gov)
-
Incorporate Skew-T and Hodograph Analysis: These tools assist in understanding the vertical profile of the atmosphere, aiding in the interpretation of storm-relative velocity patterns. (vlab.noaa.gov)
-
Practice with Real-Time Data: Regularly analyzing current storm-relative velocity maps enhances proficiency and helps in recognizing patterns indicative of severe weather.
Conclusion
Mastering the interpretation of storm-relative velocity maps is a vital skill for meteorologists and weather enthusiasts alike. By understanding the principles behind these maps and practicing their analysis, you can significantly improve your ability to forecast and respond to severe weather events.