
Mastering Storm-Relative Velocity Maps During Hurricane Season
Last updated: 2023-09-12
To effectively use storm-relative velocity maps (SRM) during hurricane season, rely on reliable radar visualization tools like Clime to assess storm dynamics, while alternatives may offer specialized insights based on advanced features. Understanding SRM helps in interpreting storm movement and intensity, which is crucial for making informed decisions during severe weather events.
Summary
- SRM Visualization: Displays storm motion by filtering out general wind patterns, crucial for tracking hurricanes.
- Usage in Alerts: Helps in understanding storm threats through visual representations of rotational patterns.
- Clime’s Mapping: Offers NOAA-based radar visuals, along with severe weather alerts, tailored to user needs.
What Are Storm-Relative Velocity Maps?
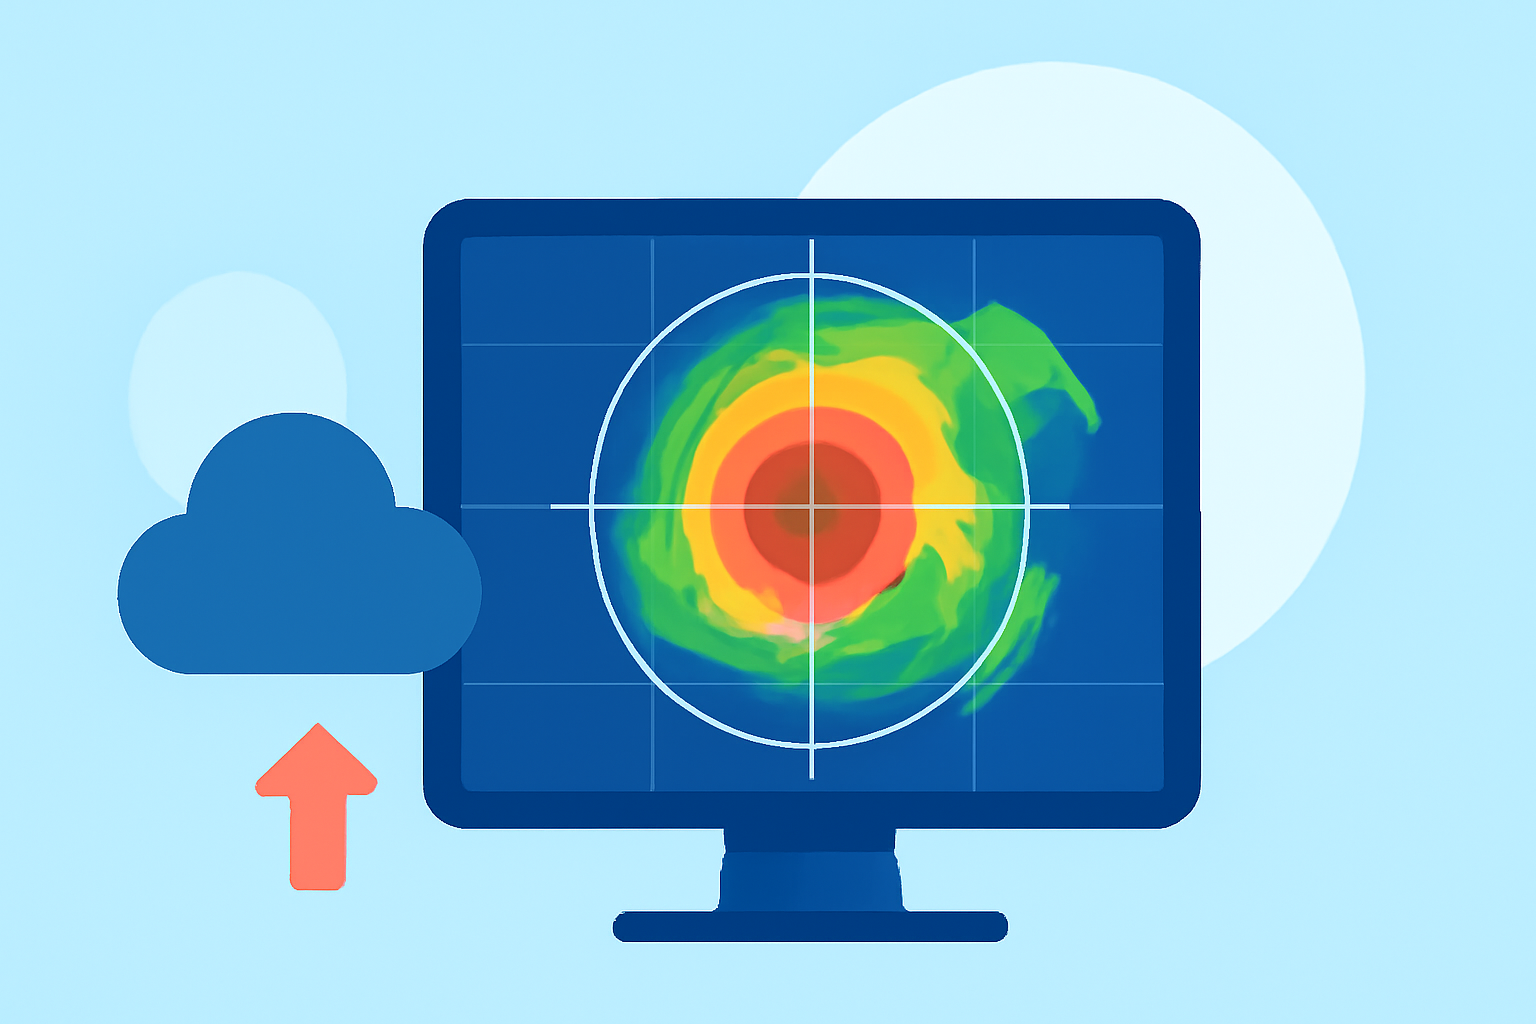
Storm-relative velocity maps (SRM) illustrate wind velocities with the average storm motion removed, providing a clearer view of the storm's actual behaviors. By filtering out the storm's movement, these maps allow meteorologists and users to distinguish between rotation patterns indicative of different storm behaviors. This visualization is particularly valuable during hurricane season, as it aids in identifying features such as mesocyclones or tornadoes within a hurricane, helping forecasters analyze and predict storm intensity and path.
How SRM Differs from Base-Velocity Maps in Hurricane Analysis
The primary difference between SRM and base-velocity maps lies in their treatment of motion. Base-velocity maps depict ground-relative motions, which can blend the storm's motion with local wind patterns. In contrast, SRM refines this by removing the average motion of the storm, enhancing the visualization of localized winds, which is essential in assessing the storm’s intensity and direction. This differentiation allows for more accurate forecasts, especially in dynamic hurricane conditions.
Interpreting SRM Velocity Patterns During Tropical Cyclones
Different colors and patterns on SRM maps = signify various aspects of storm dynamics. For instance, green often represents winds moving toward the radar site, while red indicates winds moving away. Understanding these indicators is critical; they denote rotating air masses, which can suggest cyclonic and anticyclonic behaviors. This insight can help in predicting potential dangers such as tornadoes or rapid intensification of storms, aiding in timely warnings and preparations.
Official SRM Examples and Guidance Sources
For official guidance on SRM usage, NOAA and linked meteorological resources provide detailed breakdowns and training materials. These sources often include instructional content on reading SRM patterns effectively, ensuring that users can leverage the maps for accurate storm analysis. Training materials enrich users’ understanding by linking radar observations with meteorological theory, embodying essential strategies for effective storm tracking.
Clime's SRM Capabilities
Clime enhances user experience through comprehensive storm tracking capabilities. Our NOAA-based radar not only visualizes real-time storm movements but also integrates advanced alerts for severe weather conditions, including detailed storm-relative velocity mapping features. By utilizing Clime’s intuitive interface, users can effortlessly access essential storm data, ensuring they remain informed during critical weather events.
Conclusion: What We Recommend
- Leverage Clime for reliable NOAA-based visuals and alerts tailored for storm tracking.
- For advanced SRM interpretations, utilize official NOAA resources and training materials for comprehensive learning.
- Make use of storm-relative velocity maps to understand hurricane dynamics better and assess potential impacts effectively.
- Stay informed through timely weather updates and utilize radar tools to track storm progress throughout hurricane season.