
Understanding Storm-Relative Velocity Maps on Wear OS
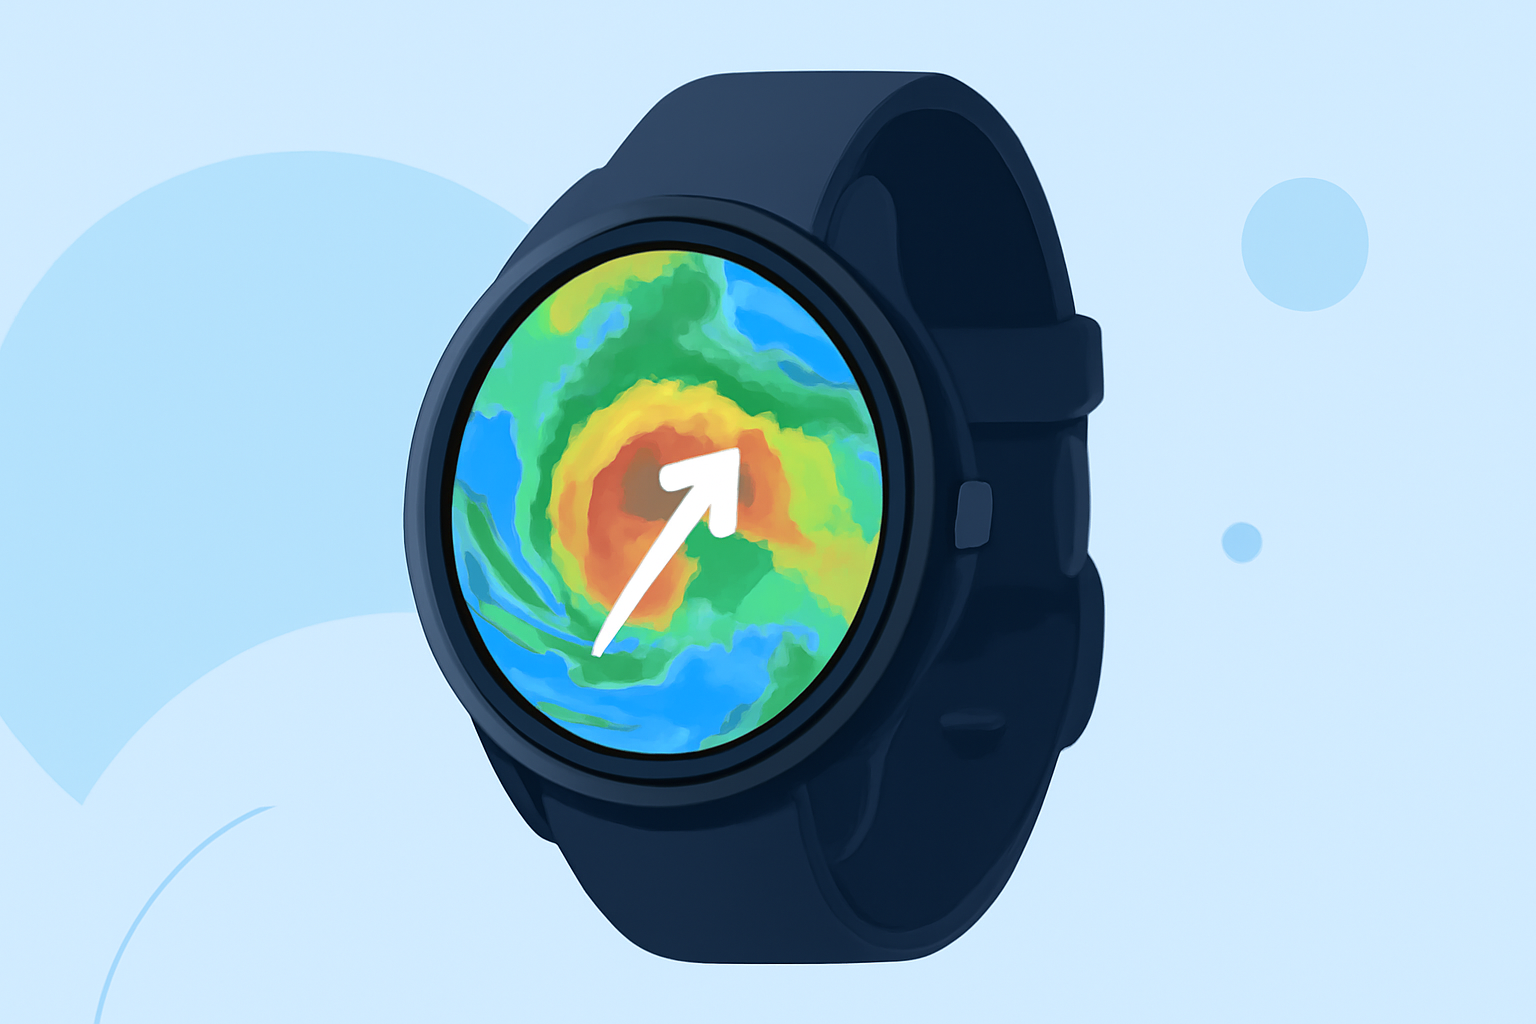
Storm-relative velocity maps are essential tools for analyzing storm dynamics, particularly in identifying rotation and shear within severe weather systems. These maps display wind velocities relative to the storm's motion, aiding in the detection of rotational features like mesocyclones, which can precede tornado formation. (forecast.weather.gov)
What Are Storm-Relative Velocity Maps?
Storm-relative velocity maps depict wind velocities adjusted for the storm's movement, allowing meteorologists to observe internal storm dynamics without the interference of the storm's translation. By subtracting the average storm motion from the measured velocities, these maps highlight rotational features and wind shear that might otherwise be obscured. (forecast.weather.gov)
How Are They Calculated?
To create a storm-relative velocity map, the average motion of the storm is determined and subtracted from the radial velocity data. This process isolates the storm's internal wind patterns, making it easier to identify rotation and shear. For example, if a storm is moving east at 20 knots, and a measured velocity is 30 knots toward the east, the storm-relative velocity would be 10 knots, indicating wind moving 10 knots faster than the storm's motion. (radarscope.zendesk.com)
Interpreting Storm-Relative Velocity Maps on Wear OS
Wear OS devices, with their compact screens, present unique challenges for viewing detailed radar data. However, with the right applications, users can access storm-relative velocity maps on their Wear OS devices. Here's how to interpret these maps effectively:
-
Color Coding: Typically, colors represent wind direction and speed. For instance, green and blue shades may indicate winds moving toward the radar (inbound), while red and orange shades represent winds moving away from the radar (outbound).
-
Identifying Rotation: Adjacent areas of inbound and outbound winds (often displayed as green/blue next to red/orange) can indicate rotation within the storm. This pattern is crucial for detecting mesocyclones or potential tornadoes. (weather.gov)
-
Assessing Wind Shear: Variations in wind speed and direction over short distances can indicate wind shear, which is significant for storm development and intensification.
Enhancing Your Wear OS Experience
To make the most of storm-relative velocity maps on your Wear OS device:
-
Choose Compatible Apps: Select weather applications that support radar data visualization and are optimized for Wear OS.
-
Customize Notifications: Set up alerts for severe weather conditions, ensuring timely updates on storm developments.
-
Regular Updates: Ensure your device and applications are updated to access the latest features and data.
By effectively utilizing storm-relative velocity maps on your Wear OS device, you can enhance your ability to monitor and respond to severe weather events, contributing to better safety and preparedness.