
Understanding Animated Weather Radar During Severe Weather Events
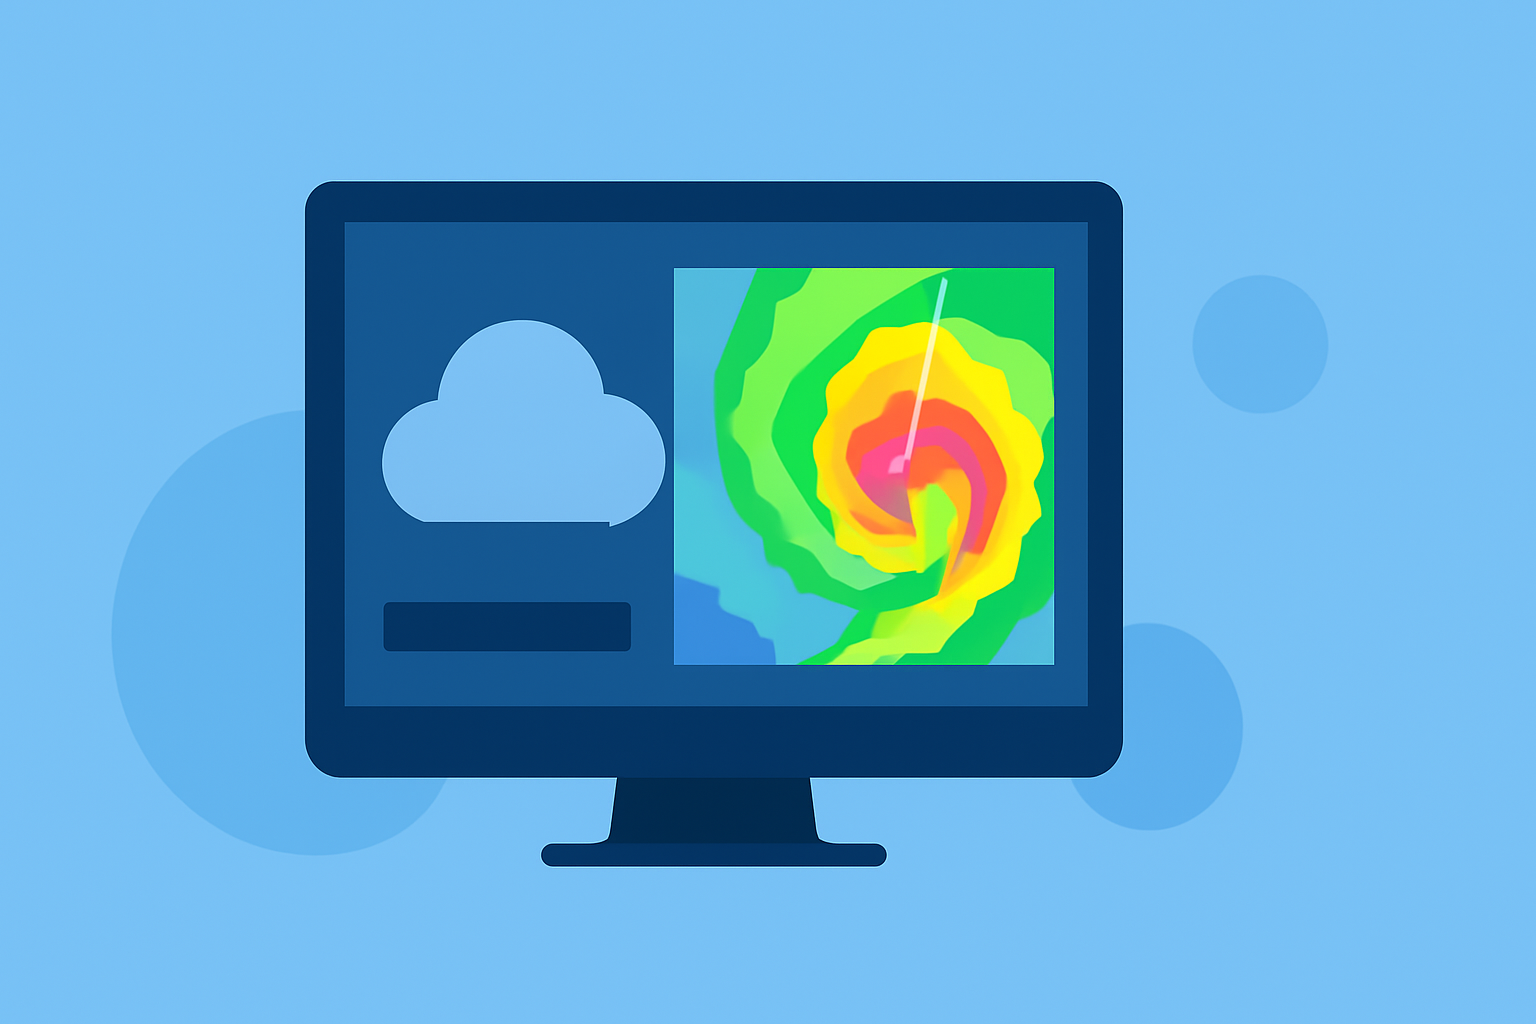
Animated weather radar is a vital tool for monitoring severe weather events, providing real-time insights into storm development and movement. By understanding how to read these animations, you can make informed decisions to stay safe during adverse weather conditions.
What Does Animated Weather Radar Show?
Animated weather radar displays precipitation intensity and movement over time. The animation of radar products can show the evolution of reflectivity and velocity patterns, allowing users to observe storm development or dissipation. (en.wikipedia.org)
How Do I Interpret Radar Colors?
Radar images use color gradients to indicate precipitation intensity:
- Green: Light rain or snow
- Yellow: Moderate precipitation
- Red: Heavy rain or intense storms
Understanding these color codes helps in assessing the severity of weather conditions.
What Are Reflectivity and Velocity in Radar Data?
Reflectivity measures the amount of energy returned to the radar, indicating precipitation intensity. Velocity data shows the speed and direction of precipitation particles, aiding in identifying wind patterns and potential rotation within storms. (weather.gov)
How Can I Use Animated Radar to Track Storms?
By observing the movement and development of precipitation over time, you can track storm paths and anticipate their impact. This information is crucial for making timely decisions during severe weather events.
How Does Clime Enhance Storm Tracking?
Clime offers advanced tools for monitoring severe weather, including live alerts, radar, satellite imagery, and forecasts. These features provide a comprehensive view of weather conditions, helping you stay informed and prepared.
By understanding and utilizing animated weather radar, you can effectively monitor severe weather events and make informed decisions to ensure your safety.