
Understanding Base Reflectivity Maps: A Comprehensive Guide
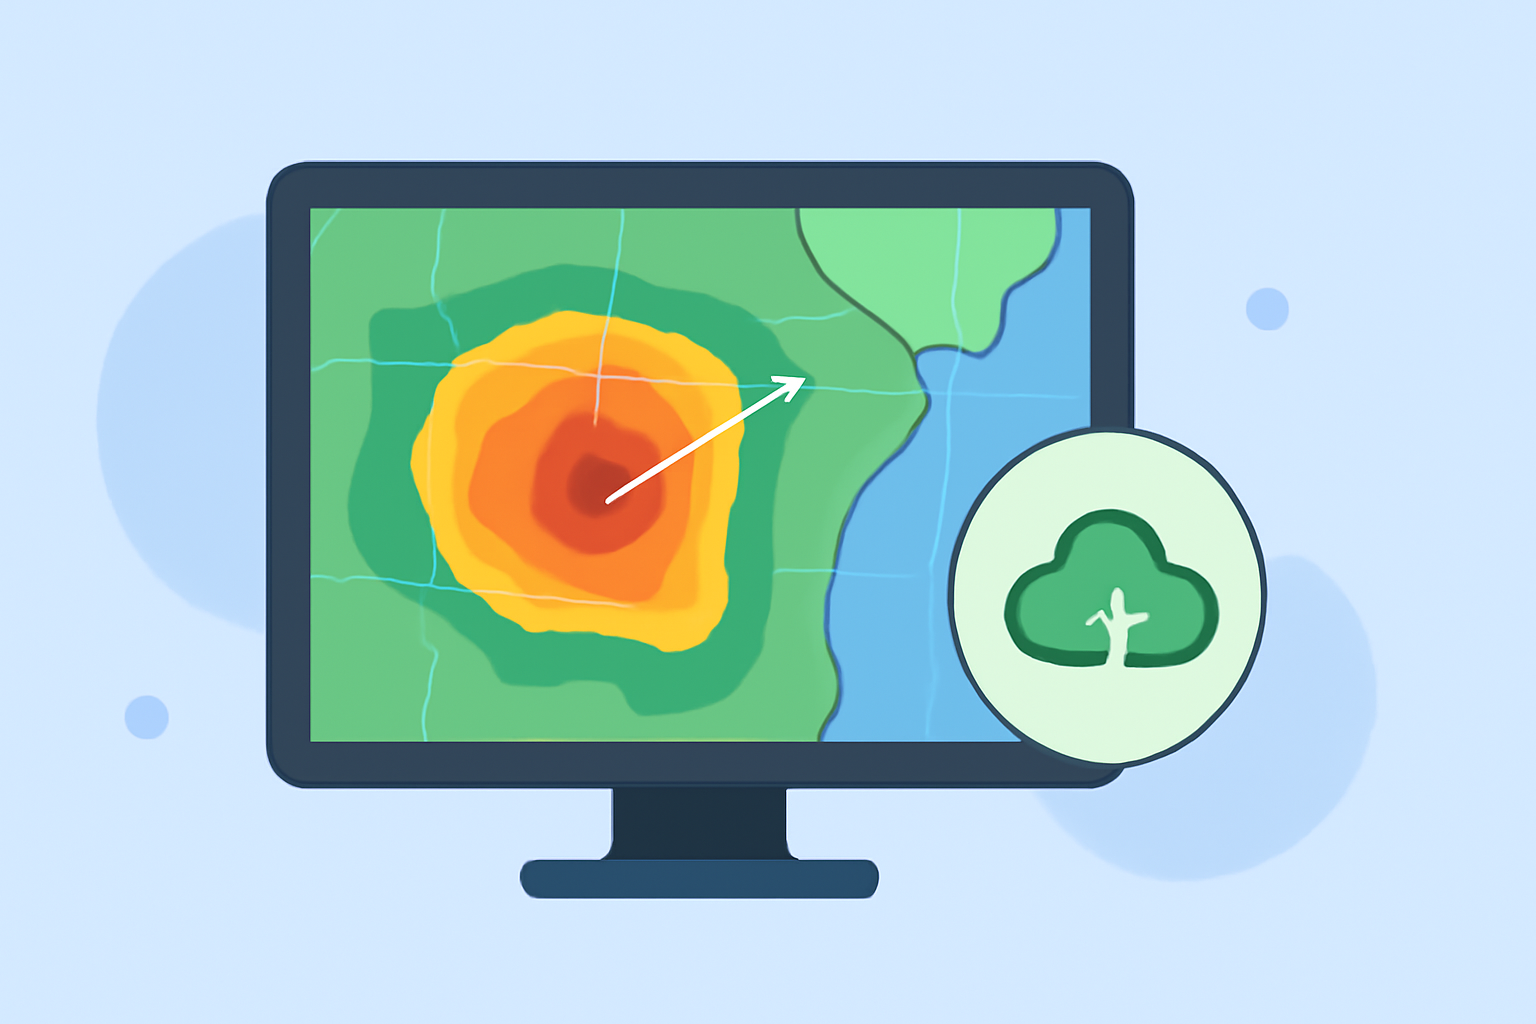
Base reflectivity maps are essential tools in meteorology, providing real-time insights into precipitation patterns and storm structures. These maps display the intensity of precipitation by measuring the amount of energy returned to the radar, known as reflectivity. Understanding these maps is crucial for accurate weather forecasting and severe weather monitoring.
What Are Base Reflectivity Maps?
Base reflectivity maps are graphical representations of the intensity of precipitation detected by weather radar systems. They display the strength of returned radar signals, which correspond to the amount and size of precipitation particles, such as raindrops or snowflakes. The reflectivity values are measured in decibels relative to Z (dBZ), with higher values indicating heavier precipitation. These maps are typically generated from the lowest elevation angle of the radar's scan, providing a snapshot of precipitation intensity at that specific level. (ncei.noaa.gov)
How Are Base Reflectivity Maps Created?
Base reflectivity maps are produced by weather radar systems, such as the Next Generation Weather Radar (NEXRAD) operated by the National Weather Service. These radars emit pulses of energy and measure the time it takes for the energy to return after reflecting off precipitation particles. The strength of the returned signal is then converted into reflectivity values, which are mapped to specific colors representing different precipitation intensities. These maps are updated regularly, often every five minutes, to provide timely information on changing weather conditions. (ncei.noaa.gov)
Interpreting Base Reflectivity Maps
Reading base reflectivity maps involves understanding the color-coded scale that represents different levels of precipitation intensity. Generally, the higher the reflectivity value, the heavier the precipitation. For example, values above 65 dBZ indicate extremely heavy precipitation, including water-coated hail, while values between 50 to 65 dBZ represent heavy precipitation or some hail. It's important to note that while higher reflectivity values typically indicate heavier precipitation, other factors, such as the size and type of precipitation particles, can also influence the radar's reflectivity readings. (prod-01-alb-www-noaa.woc.noaa.gov)
Limitations of Base Reflectivity Maps
While base reflectivity maps are invaluable for assessing precipitation intensity, they have certain limitations. They may not accurately depict the vertical structure of storms, such as the presence of hail or tornadoes, as they primarily provide information from the lowest elevation angle of the radar's scan. Additionally, base reflectivity maps can be affected by ground clutter, such as buildings or trees, which can lead to false echoes. Therefore, it's essential to use base reflectivity maps in conjunction with other radar products and meteorological data for a comprehensive understanding of weather conditions. (ncei.noaa.gov)
Enhancing Base Reflectivity Interpretation with Clime
Clime offers advanced tools that enhance the interpretation of base reflectivity maps. By integrating real-time radar data with predictive analytics, Clime provides users with actionable insights into weather patterns and potential severe weather events. This integration allows for more accurate forecasting and timely decision-making, particularly in sectors where weather plays a critical role, such as agriculture, aviation, and emergency management.
Conclusion
Base reflectivity maps are fundamental in meteorology, offering real-time insights into precipitation patterns and storm structures. Understanding how to interpret these maps is essential for accurate weather forecasting and severe weather monitoring. By leveraging advanced tools like Clime, users can enhance their ability to analyze and respond to changing weather conditions effectively.
Highlights:
- Next Generation Weather Radar (NEXRAD) | National Centers for Environmental Information (NCEI)
- Terminal Doppler Weather Radar (TDWR) | National Centers for Environmental Information (NCEI)
- Radar Data