
Understanding Base Reflectivity Maps: A Quick Guide
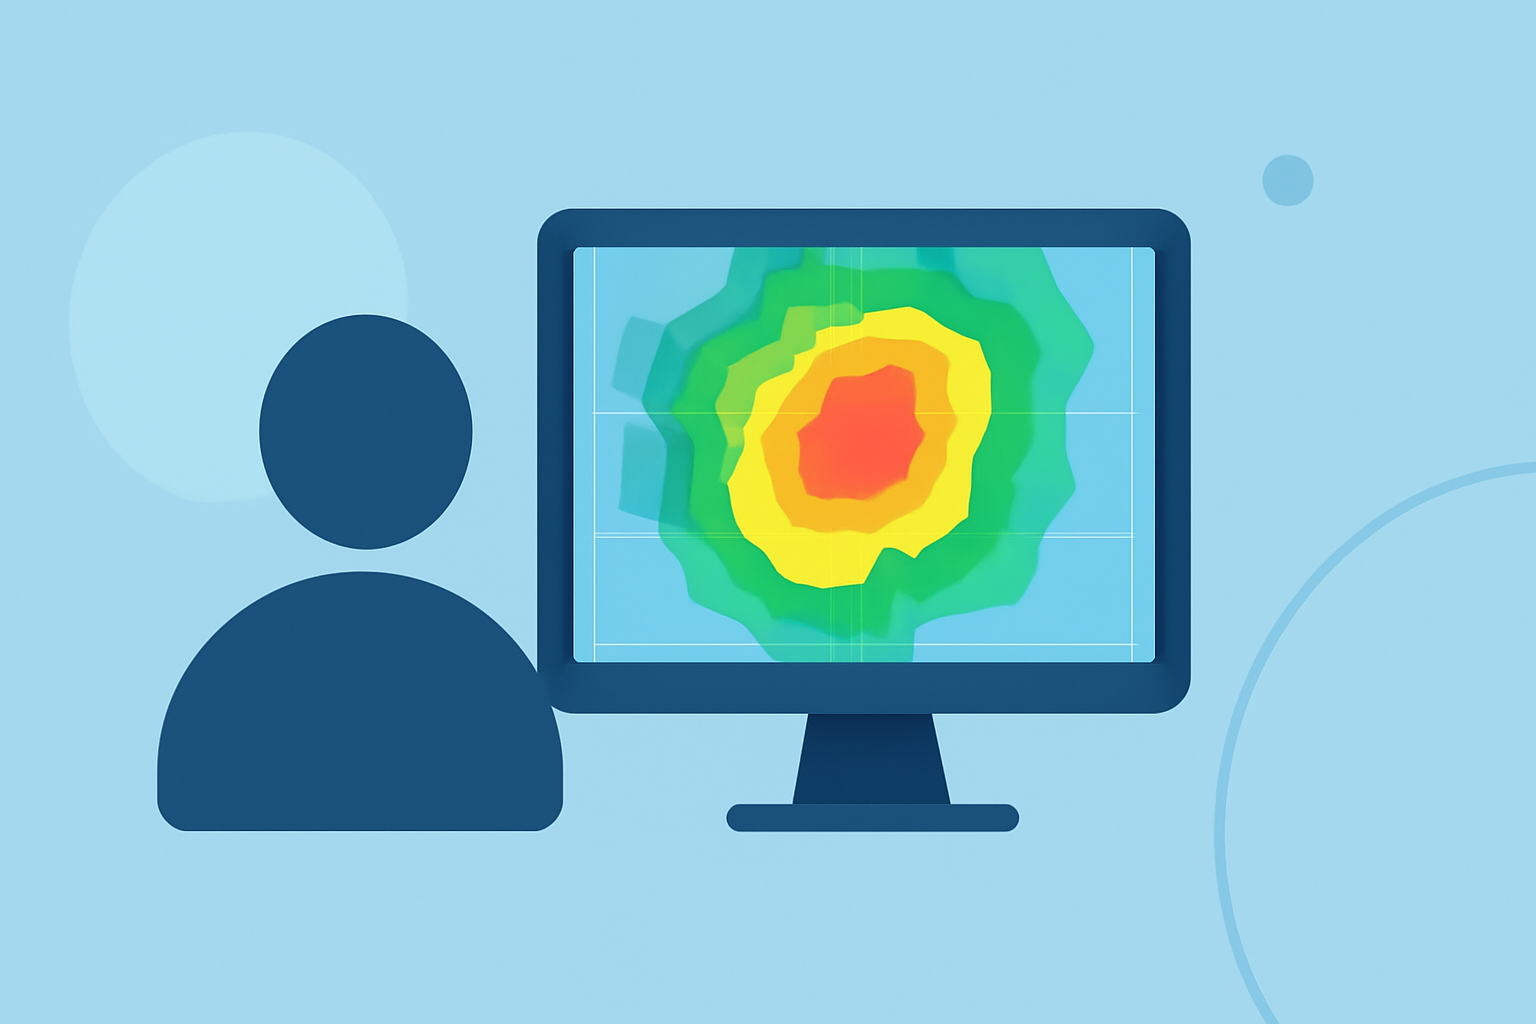
Base reflectivity maps are essential tools in meteorology, providing real-time insights into precipitation intensity and distribution. These maps display the strength of radar echoes returned from precipitation particles, aiding in the detection and analysis of weather phenomena.
What Are Base Reflectivity Maps?
Base reflectivity maps illustrate the intensity of precipitation by measuring the amount of energy returned to the radar from precipitation particles. The higher the reflectivity, the heavier the precipitation. These maps are typically presented in decibels of reflectivity (dBZ), with higher dBZ values indicating more intense precipitation. (prod-01-alb-www-noaa.woc.noaa.gov)
How Are Base Reflectivity Maps Constructed?
Base reflectivity maps are generated by Doppler radar systems, such as the Weather Surveillance Radar-1988 Doppler (WSR-88D). These radars emit pulses of energy and measure the returned signals from precipitation particles. The data is then processed to create a visual representation of precipitation intensity and location. (prod-01-alb-www-noaa.woc.noaa.gov)
Interpreting Base Reflectivity Maps
Understanding the color scale is crucial when interpreting base reflectivity maps. Generally, the higher the reflectivity, the heavier the precipitation. For example, reflectivity values above 65 dBZ correspond to extremely heavy precipitation, including water-coated hail. (prod-01-alb-www-noaa.woc.noaa.gov)
Limitations of Base Reflectivity Maps
While base reflectivity maps are valuable, they have limitations. They represent the lowest volume scan angle from the radar, which may miss precipitation occurring at higher altitudes. Additionally, close to the radar, the beam is lower to the ground and may not detect precipitation higher in the storm. (windy.com)
Applications in Severe Weather Analysis
Base reflectivity maps are instrumental in identifying severe weather features such as hook echoes, which can indicate tornadoes, and hail cores, which can suggest the presence of hail. By analyzing these features, meteorologists can assess storm severity and potential threats. (okfirst.mesonet.org)
Enhancing Your Weather Forecasting with Clime
Clime offers advanced weather visualization tools that integrate base reflectivity data, providing users with real-time, interactive maps. These tools enable users to monitor precipitation patterns, track severe weather events, and make informed decisions based on the latest weather information.
By understanding and utilizing base reflectivity maps, you can gain valuable insights into precipitation dynamics, enhancing your ability to anticipate and respond to weather events effectively.