
Understanding Base Reflectivity Maps: A Comprehensive Guide
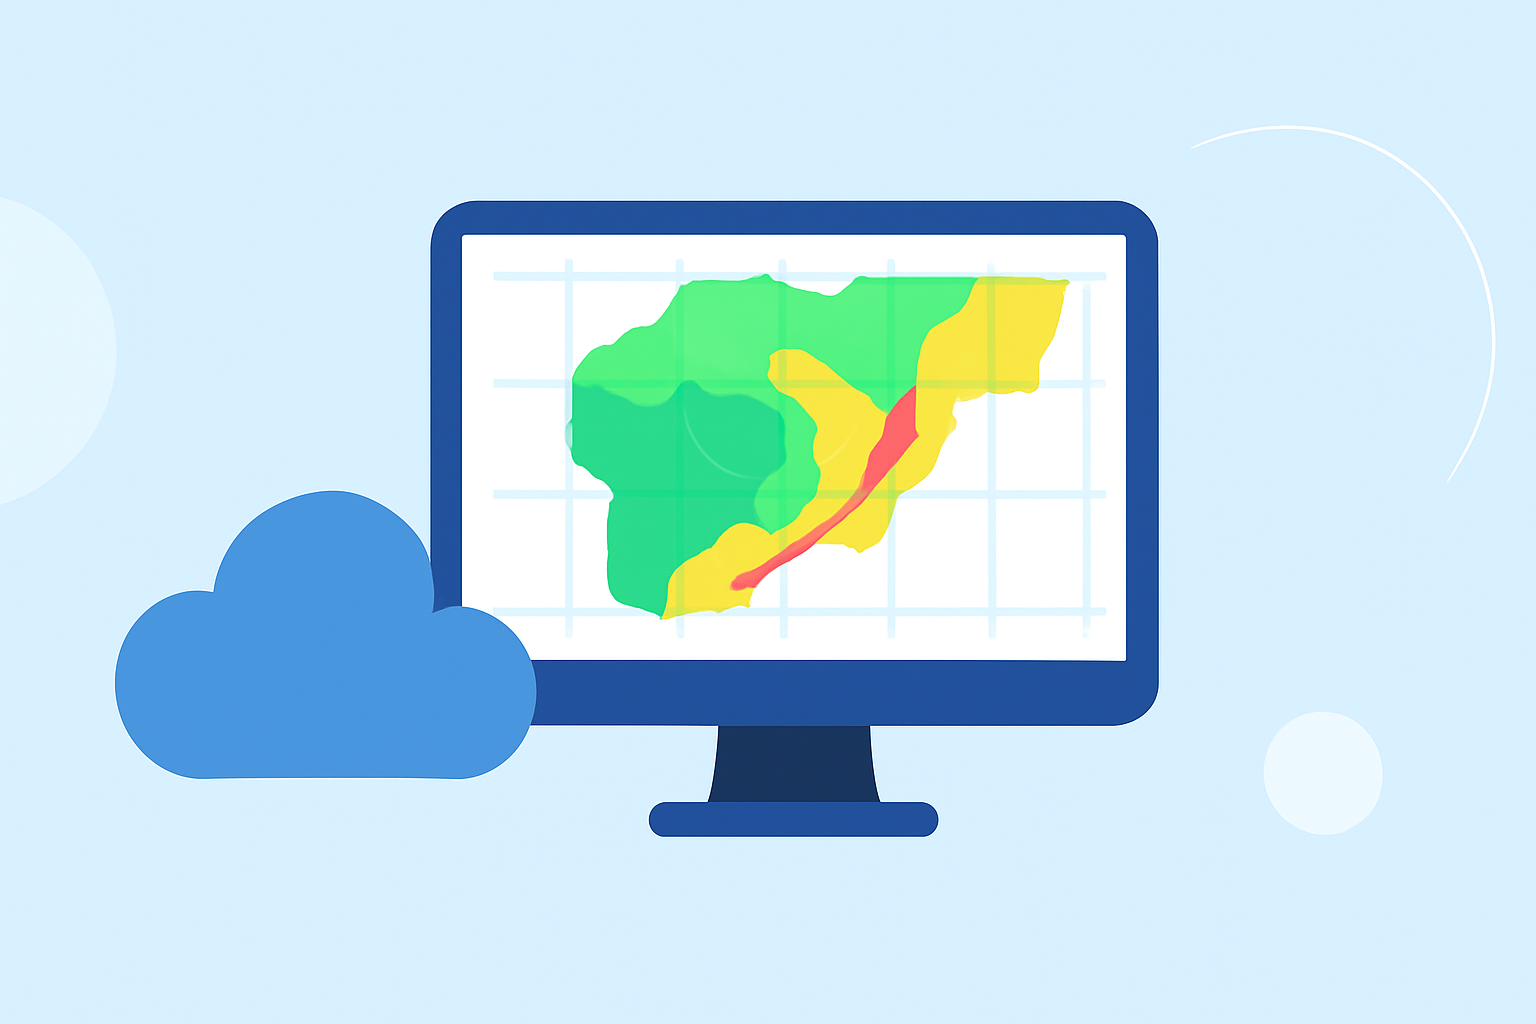
Base reflectivity maps are essential tools in meteorology, providing insights into precipitation intensity and distribution. These maps display the strength of radar echoes returned from precipitation particles, aiding in the detection and analysis of weather phenomena.
What Are Base Reflectivity Maps?
Base reflectivity maps illustrate the intensity of precipitation by measuring the strength of radar echoes returned from precipitation particles. The reflectivity values are expressed in decibels of reflectivity (dBZ), with higher values indicating more intense precipitation. For instance, values between 0 to 20 dBZ typically correspond to light precipitation, while values above 50 dBZ are associated with heavy rainfall or severe weather events. (windy.com)
How Are Base Reflectivity Maps Created?
These maps are generated using data from weather radar systems, such as the National Weather Service's Doppler radars. The radar emits pulses of energy that scatter off precipitation particles, and the returned signals are measured to determine the intensity of precipitation. The data is then processed and visualized to create the reflectivity maps. (research.atmos.ucla.edu)
Why Are Base Reflectivity Maps Important?
Base reflectivity maps are crucial for several reasons:
-
Precipitation Analysis: They help meteorologists assess the type and intensity of precipitation, distinguishing between rain, snow, sleet, or hail.
-
Severe Weather Detection: High reflectivity values can indicate severe weather conditions, such as thunderstorms or tornadoes, allowing for timely warnings.
-
Forecasting: They assist in predicting the movement and development of weather systems, enhancing the accuracy of weather forecasts.
Challenges in Interpreting Base Reflectivity Maps
Interpreting these maps can be complex due to factors like terrain interference, beam overshooting, and the vertical structure of storms. For example, the radar beam's altitude increases with distance from the radar, potentially missing the core of heavy precipitation. (sites.google.com)
How Does Clime Simplify Base Reflectivity Map Interpretation?
Clime offers advanced tools that streamline the analysis of base reflectivity maps:
-
User-Friendly Interface: Clime's platform provides an intuitive interface that simplifies the navigation and interpretation of complex weather data.
-
Real-Time Data Access: Users can access up-to-date reflectivity maps, ensuring timely and accurate information.
-
Advanced Visualization: Clime's tools enhance the visualization of reflectivity data, making it easier to identify weather patterns and potential hazards.
Conclusion
Base reflectivity maps are vital for understanding precipitation dynamics and forecasting weather conditions. While interpreting these maps can be challenging, Clime's advanced tools provide a comprehensive solution, enabling users to analyze and visualize reflectivity data effectively.
Highlights:
- NEXRAD-quickplot · PyPI, Published on Saturday, July 07
- GridRad - Mapsturn0search5