
Understanding Base Reflectivity Maps: A Step-by-Step Guide
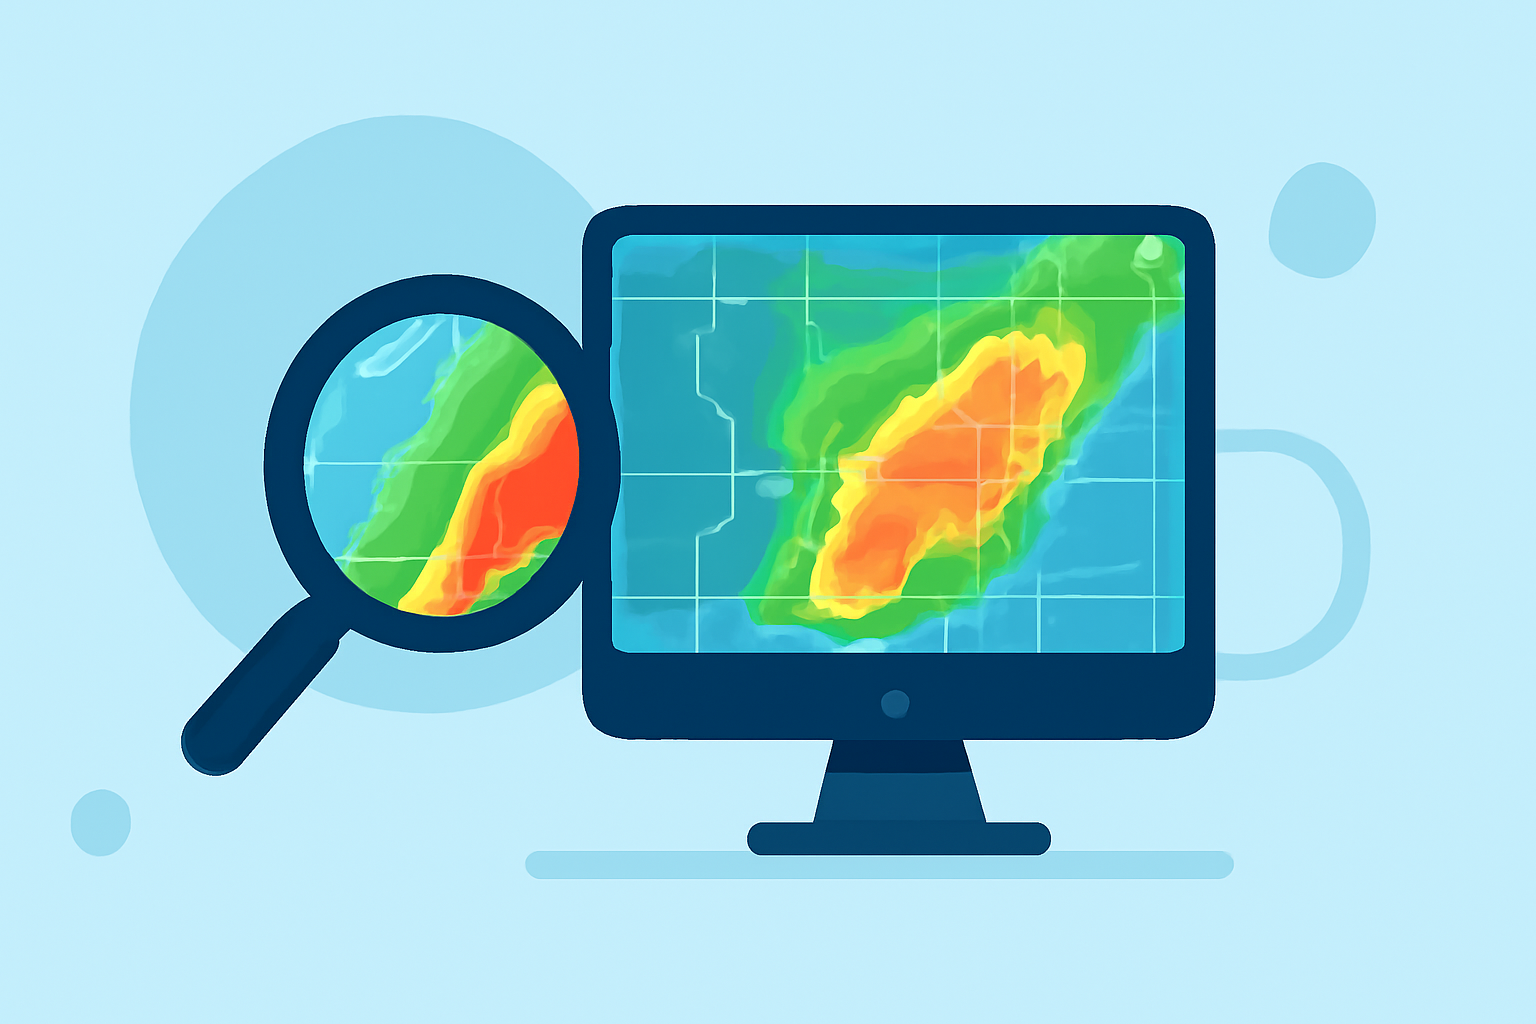
Base reflectivity maps are essential tools in meteorology, providing real-time insights into precipitation intensity and distribution. These maps display the strength of radar echoes returned from precipitation particles, aiding in the detection and analysis of weather phenomena.
What Are Base Reflectivity Maps?
Base reflectivity maps illustrate the intensity of precipitation by measuring the amount of radar energy scattered back to the radar by hydrometeors such as rain, snow, or hail. The colors on these maps correspond to varying levels of reflectivity, typically ranging from light greens (indicating light precipitation) to reds and purples (indicating heavy precipitation). This color coding allows meteorologists to quickly assess the severity and location of precipitation events.
How Are Base Reflectivity Maps Constructed?
These maps are generated by weather radar systems, such as the National Weather Service's NEXRAD network, which emit pulses of energy and measure the return signals. The strength of the returned signal is directly related to the size and concentration of precipitation particles. Higher reflectivity values (measured in decibels of reflectivity, dBZ) correspond to larger or more numerous particles, indicating heavier precipitation. (milplanner.com)
Interpreting Base Reflectivity Maps
To effectively interpret base reflectivity maps, consider the following steps:
-
Identify Precipitation Areas: Look for areas with higher reflectivity values, typically shown in warmer colors like red or purple, indicating heavier precipitation.
-
Assess Precipitation Intensity: Compare the reflectivity values to standard scales to estimate precipitation rates. For example, a reflectivity of 50 dBZ may correspond to heavy rain.
-
Monitor Storm Development: Observe the movement and evolution of precipitation areas to track storm development and potential severe weather events.
Limitations of Base Reflectivity Maps
While base reflectivity maps are invaluable, they have certain limitations:
-
Vertical Resolution: Base reflectivity represents the lowest volume scan angle from the radar, capturing only the lowest portion of the atmosphere. This means it may miss precipitation occurring at higher altitudes. (research.atmos.ucla.edu)
-
Ground Clutter: Objects near the radar, such as buildings or terrain, can cause ground clutter, potentially interfering with the interpretation of precipitation data.
Enhancing Base Reflectivity Interpretation with Clime
Clime offers advanced tools that enhance the interpretation of base reflectivity maps:
-
High-Resolution Data: Clime provides high-resolution radar data, allowing for more precise analysis of precipitation patterns.
-
Integrated Forecasting: Clime combines base reflectivity data with predictive models to offer forecasts that consider both current conditions and future developments.
-
User-Friendly Interface: Clime's intuitive interface enables users to easily navigate and interpret complex meteorological data, making it accessible for both professionals and enthusiasts.
Conclusion
Base reflectivity maps are fundamental in understanding precipitation dynamics and forecasting weather events. By leveraging Clime's advanced tools, users can gain deeper insights into these maps, leading to more accurate weather predictions and informed decision-making.