
Understanding Base Reflectivity Maps: A Comprehensive Guide
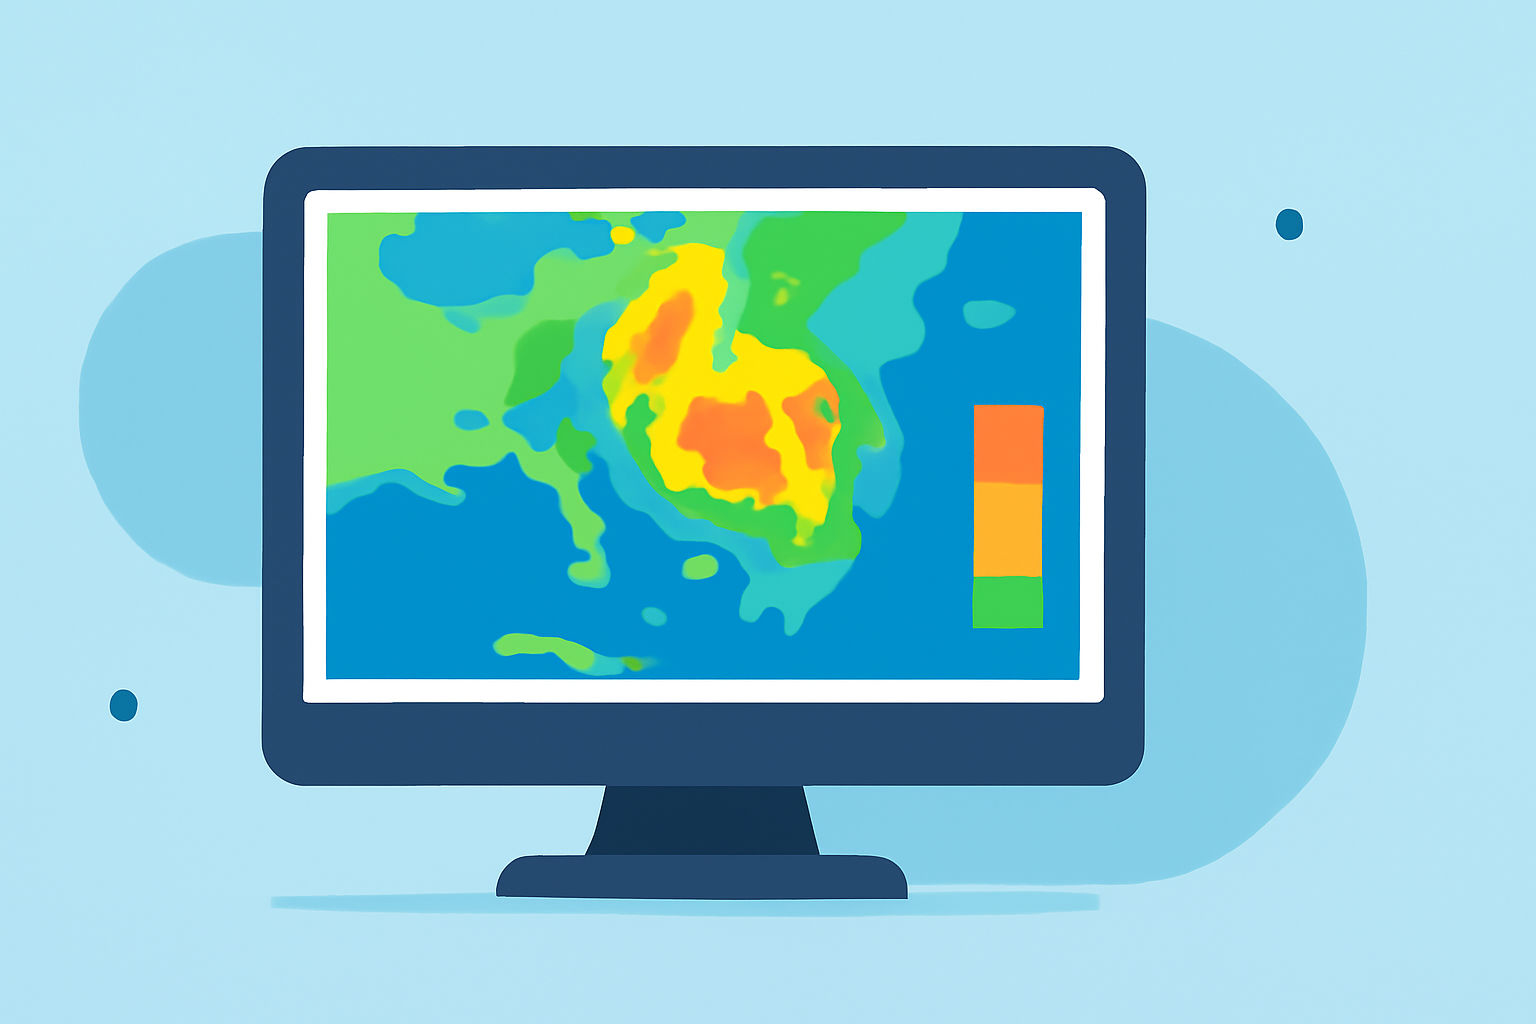
Base reflectivity maps are essential tools in meteorology, providing real-time insights into precipitation intensity and distribution. These maps are generated using data from weather radar systems, such as the Next-Generation Radar (NEXRAD), which operates across the United States. By analyzing the strength of radar echoes returned from precipitation particles, base reflectivity maps help meteorologists assess weather conditions, predict severe weather events, and inform public safety measures.
What Are Base Reflectivity Maps?
Base reflectivity maps display the intensity of precipitation by measuring the amount of energy returned to the radar by precipitation particles. The strength of this return signal, known as reflectivity, is typically expressed in decibels of Z (dBZ). Higher dBZ values indicate more intense precipitation. For example, light rain might correspond to dBZ values between 20-25, while heavy rain or hail could range from 50-60 dBZ. These maps are crucial for identifying areas of heavy rainfall, potential flooding, and severe weather phenomena like thunderstorms and tornadoes.
How Are Base Reflectivity Maps Created?
Base reflectivity maps are produced by weather radar systems that emit radio waves and measure the energy reflected back from precipitation particles. The National Weather Service's NEXRAD system, for instance, operates a network of Doppler radars that scan the atmosphere to detect precipitation and atmospheric movement. The data collected is then processed to create composite reflectivity maps, which are updated regularly to provide current weather information. These maps are available every 6 minutes and contain the most recent NEXRAD mosaic. (milplanner.com)
Interpreting Base Reflectivity Maps
Understanding base reflectivity maps involves recognizing the color-coded scales that represent different dBZ values. Typically, a color palette is used, ranging from dark green (indicating very light precipitation) to red (indicating extreme precipitation). For instance, light rain might be represented by green, moderate rain by yellow, and heavy rain or hail by red. This color coding allows meteorologists and the public to quickly assess the severity and location of precipitation.
Limitations of Base Reflectivity Maps
While base reflectivity maps are invaluable, they have certain limitations. They primarily represent the lowest slice of the atmosphere, typically around 0.5 degrees above the horizon, which means they may not capture the full vertical structure of storms. Additionally, close to the radar, the beam may be distorted by echoes from terrain or buildings, potentially affecting the accuracy of the data. (windy.com)
Enhancing Weather Analysis with Clime's Advanced Tools
Clime offers advanced weather analysis tools that integrate base reflectivity data with other meteorological information to provide comprehensive insights. By combining reflectivity data with velocity and spectrum width measurements, Clime enables users to assess not only the intensity but also the movement and structure of weather systems. This holistic approach enhances the ability to predict severe weather events, monitor storm development, and make informed decisions for public safety and resource management.
Conclusion
Base reflectivity maps are fundamental in meteorology, offering real-time insights into precipitation patterns and intensities. While they have certain limitations, integrating base reflectivity data with other meteorological information, as Clime does, provides a more comprehensive understanding of weather systems, enhancing forecasting accuracy and public safety.
Highlights:
- Windy: Weather Radar: The Science Behind the Colorful Images We See Practically Every Day
- Weather Radar Fundamentals