
Understanding Base Reflectivity Maps: A Step-by-Step Guide
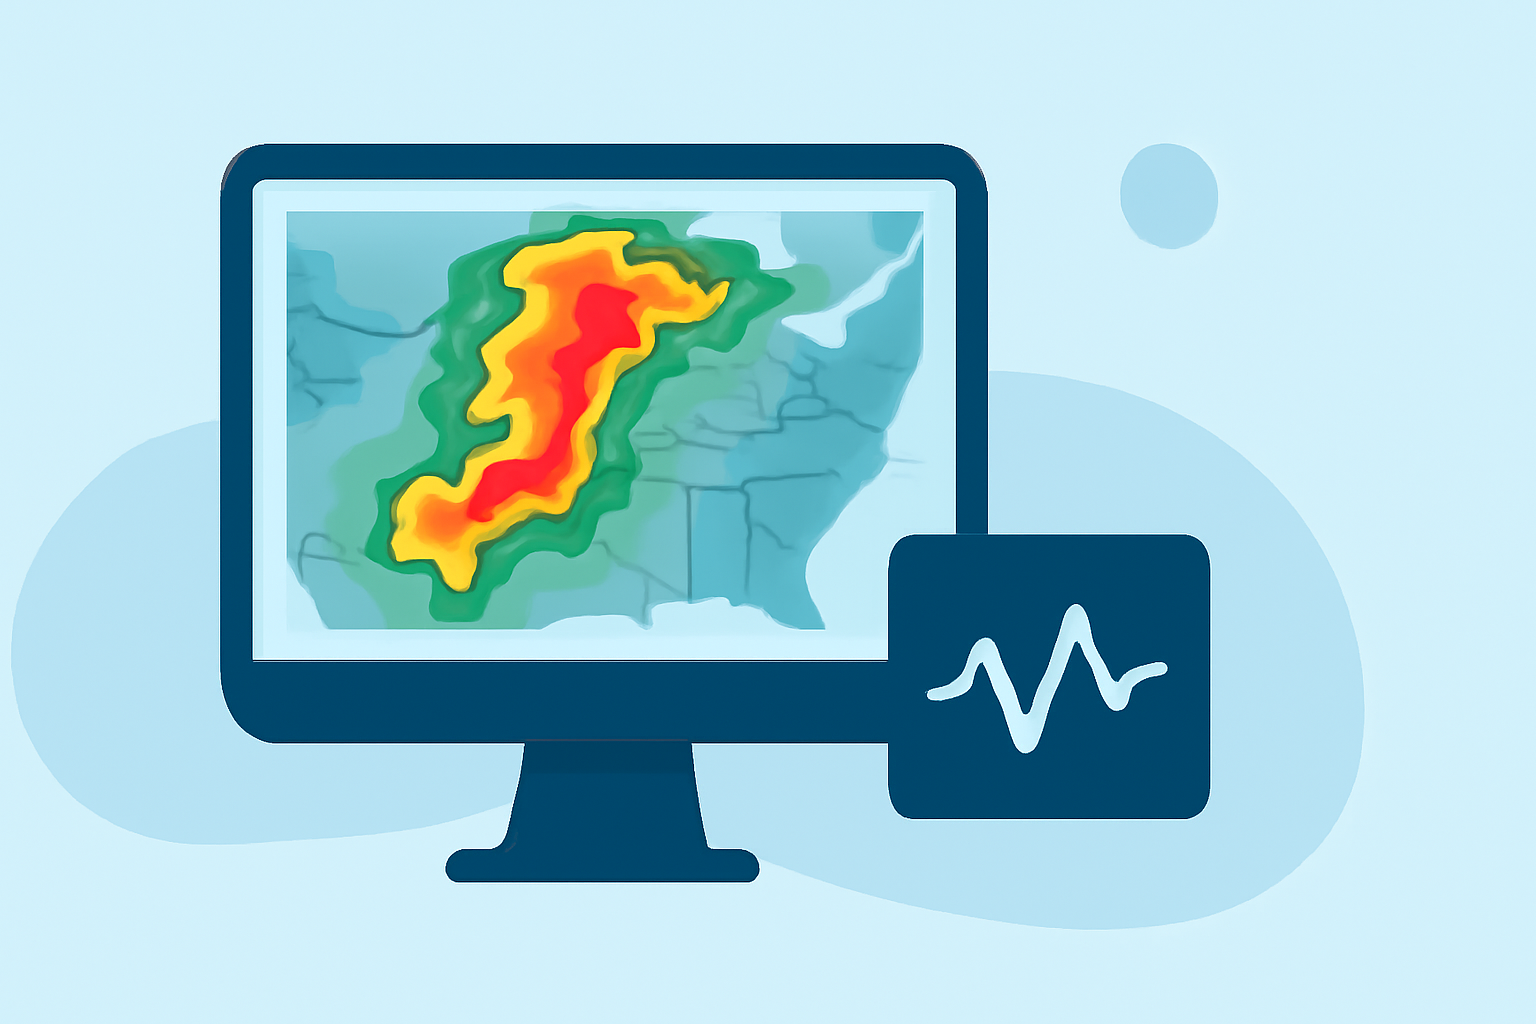
Base reflectivity maps are essential tools in meteorology, providing visual representations of precipitation intensity. They display the strength of radar echoes, which correspond to the amount of precipitation in the atmosphere. Understanding these maps is crucial for accurate weather forecasting and analysis.
What Are Base Reflectivity Maps?
Base reflectivity maps illustrate the intensity of precipitation by measuring the strength of radar echoes returned from precipitation particles. The higher the reflectivity, the heavier the precipitation. These maps are typically color-coded to represent different levels of reflectivity, aiding in the quick assessment of weather conditions. (research.atmos.ucla.edu)
How Are Base Reflectivity Maps Constructed?
Base reflectivity maps are created by radar systems that emit signals and measure the return time and strength of these signals after they bounce off precipitation particles. The data collected is then processed and displayed on a map, with colors representing varying levels of reflectivity. This process allows meteorologists to visualize precipitation patterns and intensities across different regions. (research.atmos.ucla.edu)
Interpreting Base Reflectivity Maps
To effectively interpret base reflectivity maps, follow these steps:
-
Identify Reflectivity Levels: Understand the color scale used in the map, which correlates to specific reflectivity values.
-
Assess Precipitation Intensity: Higher reflectivity values indicate heavier precipitation, while lower values suggest lighter precipitation.
-
Analyze Spatial Distribution: Observe the distribution of reflectivity to identify areas of intense precipitation, potential storm development, or regions with minimal activity.
Applications of Base Reflectivity Maps
Base reflectivity maps are utilized in various meteorological applications, including:
-
Severe Weather Monitoring: Detecting and tracking severe weather events like thunderstorms and tornadoes.
-
Flood Forecasting: Assessing rainfall intensity to predict potential flooding.
-
Aviation Safety: Providing pilots with real-time information on weather conditions to ensure flight safety.
Limitations of Base Reflectivity Maps
While base reflectivity maps are valuable, they have limitations:
-
Vertical Resolution: They represent precipitation intensity at a single elevation angle, potentially missing vertical variations in storm structure.
-
Ground Clutter: Radar signals can be affected by ground-based objects, leading to false returns.
-
Attenuation: Heavy precipitation can weaken radar signals, leading to underestimation of precipitation intensity.
Enhancing Your Understanding with Clime
Clime offers advanced tools for analyzing and visualizing base reflectivity maps, providing users with accurate and real-time weather data. Its intuitive interface and comprehensive features make it an invaluable resource for meteorologists and weather enthusiasts alike.
By mastering the interpretation of base reflectivity maps, you can gain deeper insights into weather patterns and make informed decisions based on precipitation data.