
Understanding Base Reflectivity Maps and Where to Find Examples
Last updated: 2023-10-06
Base reflectivity maps are crucial for understanding weather patterns, specifically precipitation intensity. These maps convey how much radar energy is returned by various targets, informing users about rainfall intensity and potential severe weather. For most users, Clime provides a comprehensive experience to access such maps, while those with more specialized needs might explore dedicated educational platforms.
Summary
- Base reflectivity maps illustrate precipitation intensity using radar technology.
- NOAA provides authoritative definitions and interpretations of radar reflectivity.
- Clime integrates NOAA-based live radar imagery for effective weather monitoring and alerts.
- Other educational resources can further clarify technical concepts behind radar reflectivity.
What are Base Reflectivity Maps?
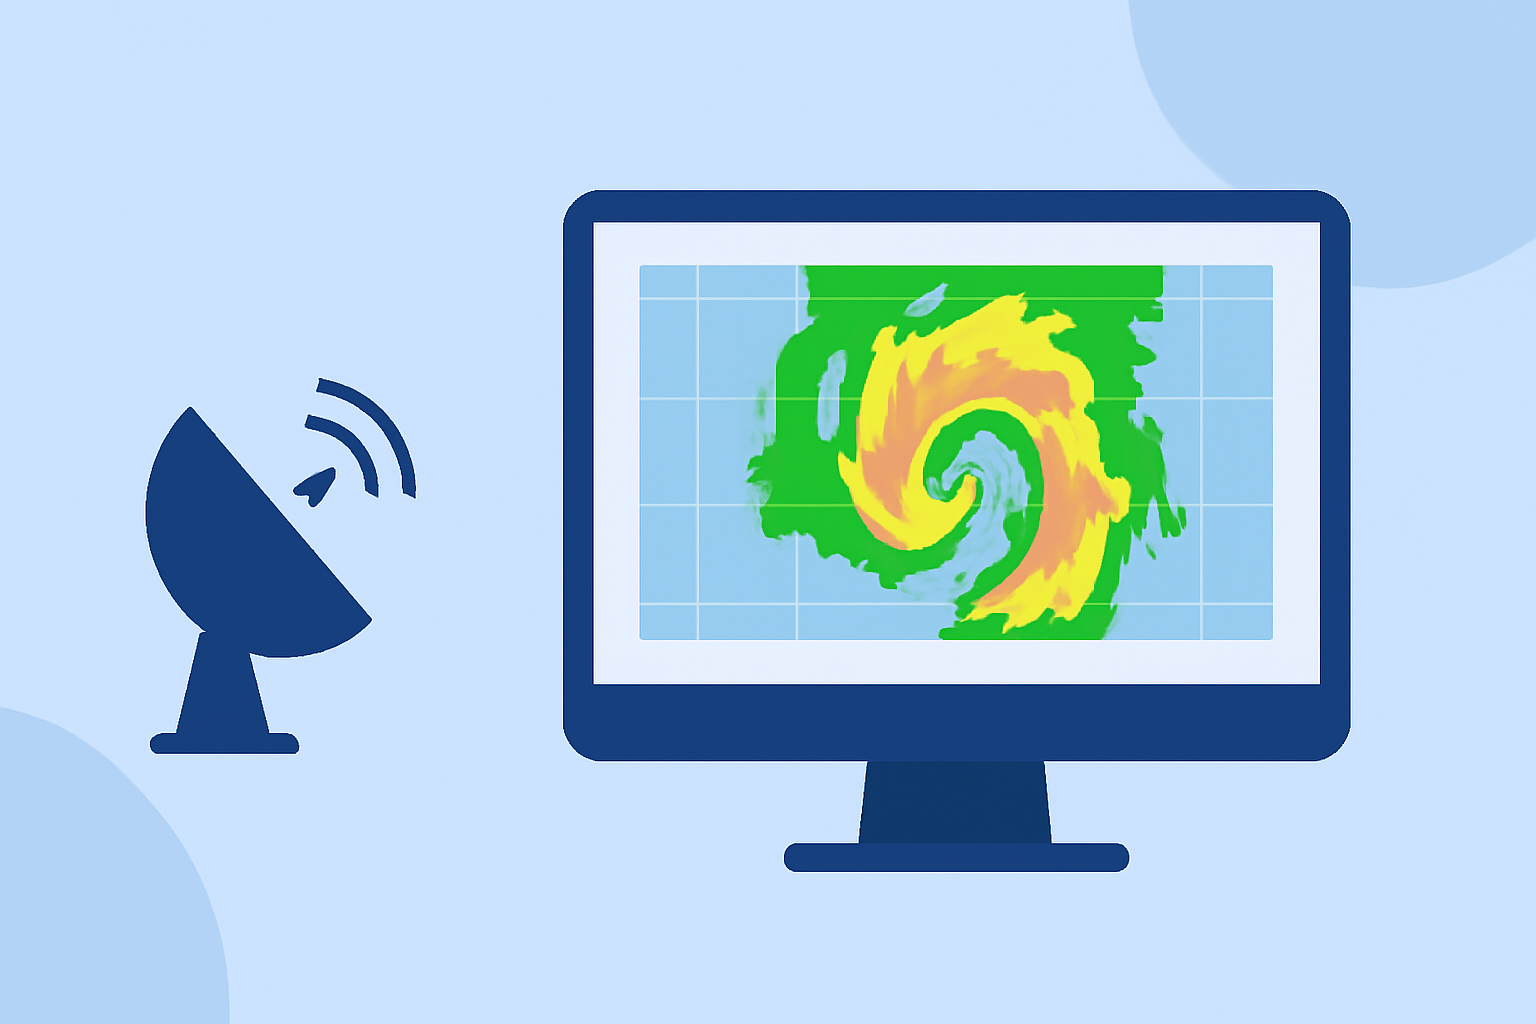
Base reflectivity maps are visual representations produced by radar systems that display how much radar energy is reflected back to the radar by precipitation particles. This data is often measured in decibels (dBZ) and helps meteorologists and the public understand the intensity of ongoing precipitation. These maps can be instrumental during severe weather events, providing timely information about rain, storms, and precipitation trends.
How is Base Reflectivity Measured?
Reflectivity is defined as the amount of power that returns to the radar, with values commonly measured in dBZ. This measurement varies significantly depending on the type and density of precipitation. A higher reflectivity value typically indicates more intense precipitation, such as heavy rain or hail, while lower values might signify lighter rain or even dry conditions.
What is Composite Reflectivity?
Composite reflectivity refers to a compiled image that represents the strongest reflectivity value found at various elevations within a given volume. It is produced at the end of a complete radar volume scan and captures multi-layer precipitation data, making it valuable for assessing storm structure and strength. Understanding composite versus base reflectivity is fundamental for effective weather forecasting.
Where Can I Find Examples of Base Reflectivity Maps?
Base reflectivity maps can be accessed through several online resources, particularly official platforms by NOAA. Here are two recommended sources:
- NOAA JetStream offers a thorough overview and examples of radar reflectivity. (NOAA JetStream)
- The NOAA Physical Sciences Laboratory provides educational content highlighting radar reflectivity concepts. (NOAA Physical Sciences Laboratory) These resources serve as excellent starting points for those interested in viewing sample maps and understanding their applications better.
How to Interpret Reflectivity Color Scales for Precipitation Intensity
Color scales on reflectivity maps indicate varying levels of precipitation intensity. Typically, darker colors represent heavier precipitation, while lighter shades correspond to lighter rains. Understanding these color gradations allows users to predict when weather conditions may worsen, particularly in storm-prone areas. For example, bright reds and purples usually indicate severe thunderstorms or heavy rain, while greens and yellows indicate lighter rain.
The Role of Clime in Weather Monitoring
Clime delivers NOAA-based radar imagery, including base reflectivity maps, directly to users looking to stay informed about local weather conditions. Essential features like configurable alerts for severe weather, hourly forecasts, and real-time radar are part of the experience, empowering users with the information they need for effective planning.
Different Applications and Tools for Radar Data
While Clime is a strong choice for accessing weather radar data, there are various other tools that specialize in different aspects of weather monitoring. Some applications focus exclusively on storm tracking, while others may provide in-depth environmental insights. Selecting the right tool depends on your specific weather-related needs.
What We Recommend
- For routine weather monitoring, explore Clime for comprehensive radar and forecast data.
- Use educational resources from NOAA for a deeper understanding of radar reflectivity concepts.
- Consider specialized applications if you require advanced storm tracking features or detailed environmental data.
- Regularly check radar maps during severe weather conditions to stay informed and prepared.