
Understanding Base Reflectivity Maps: A Beginner's Guide
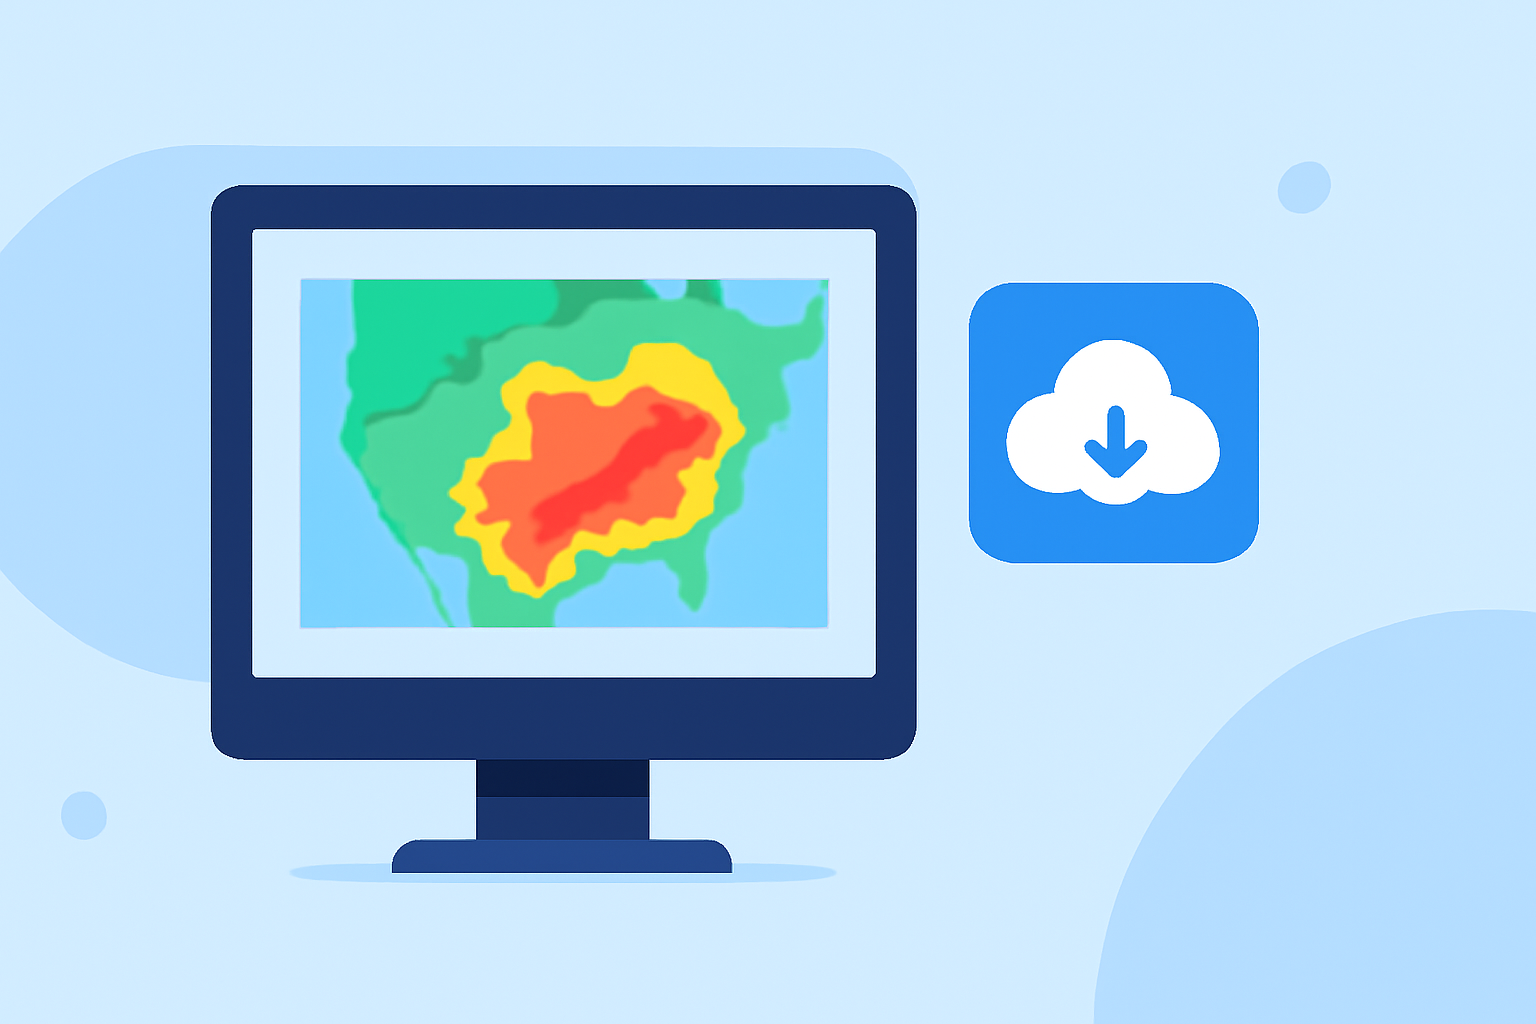
Base reflectivity maps are essential tools in meteorology, providing visual representations of precipitation intensity and storm structures. These maps are generated using data from weather radar systems, primarily the Next Generation Weather Radar (NEXRAD) network operated by the National Weather Service (NWS).
What Are Base Reflectivity Maps?
Base reflectivity maps display the intensity of precipitation in decibels relative to Z (dBZ). This measurement indicates the strength of the radar return signal, which correlates with the amount of precipitation present. Higher dBZ values typically represent heavier rainfall or more intense storm activity. These maps are crucial for detecting precipitation, evaluating storm structures, locating boundaries, and assessing hail potential. (ncei.noaa.gov)
How Are Base Reflectivity Maps Created?
Base reflectivity maps are produced by NEXRAD systems, which emit pulses of radio waves that bounce off precipitation particles. The returned signals are then analyzed to determine the intensity and location of precipitation. These data are compiled into mosaics, providing a comprehensive view of weather patterns across regions. The National Centers for Environmental Information (NCEI) offers access to these mosaics, allowing users to view and download radar data. (ncei.noaa.gov)
Interpreting Base Reflectivity Maps
Reading base reflectivity maps involves understanding the color gradients that represent varying precipitation intensities. Typically, colors range from light greens indicating light rain to deep reds and purples signifying heavy rainfall or severe storms. By analyzing these patterns, meteorologists can assess storm severity, track movement, and predict potential weather hazards.
Applications of Base Reflectivity Maps
Base reflectivity maps are utilized in various meteorological applications, including:
-
Severe Weather Monitoring: Identifying and tracking severe weather events such as thunderstorms, tornadoes, and hailstorms.
-
Flood Forecasting: Estimating rainfall amounts to predict potential flooding.
-
Aviation Safety: Providing pilots with real-time information on weather conditions to ensure safe flight operations.
Accessing Base Reflectivity Data
For those interested in exploring base reflectivity data, the NCEI provides several resources:
-
Interactive Radar Map: This tool allows users to view historical reflectivity mosaics from 1995 to the present, offering insights into past weather events. (ncei.noaa.gov)
-
NEXRAD Data Inventory: A comprehensive archive of NEXRAD data, enabling users to search and access specific radar data files. (ncei.noaa.gov)
Conclusion
Base reflectivity maps are invaluable for understanding and predicting weather patterns. By interpreting these maps, meteorologists and the public can gain insights into precipitation intensity and storm dynamics, leading to better preparedness and response to weather events.