
Understanding Base Reflectivity Maps for Travelers
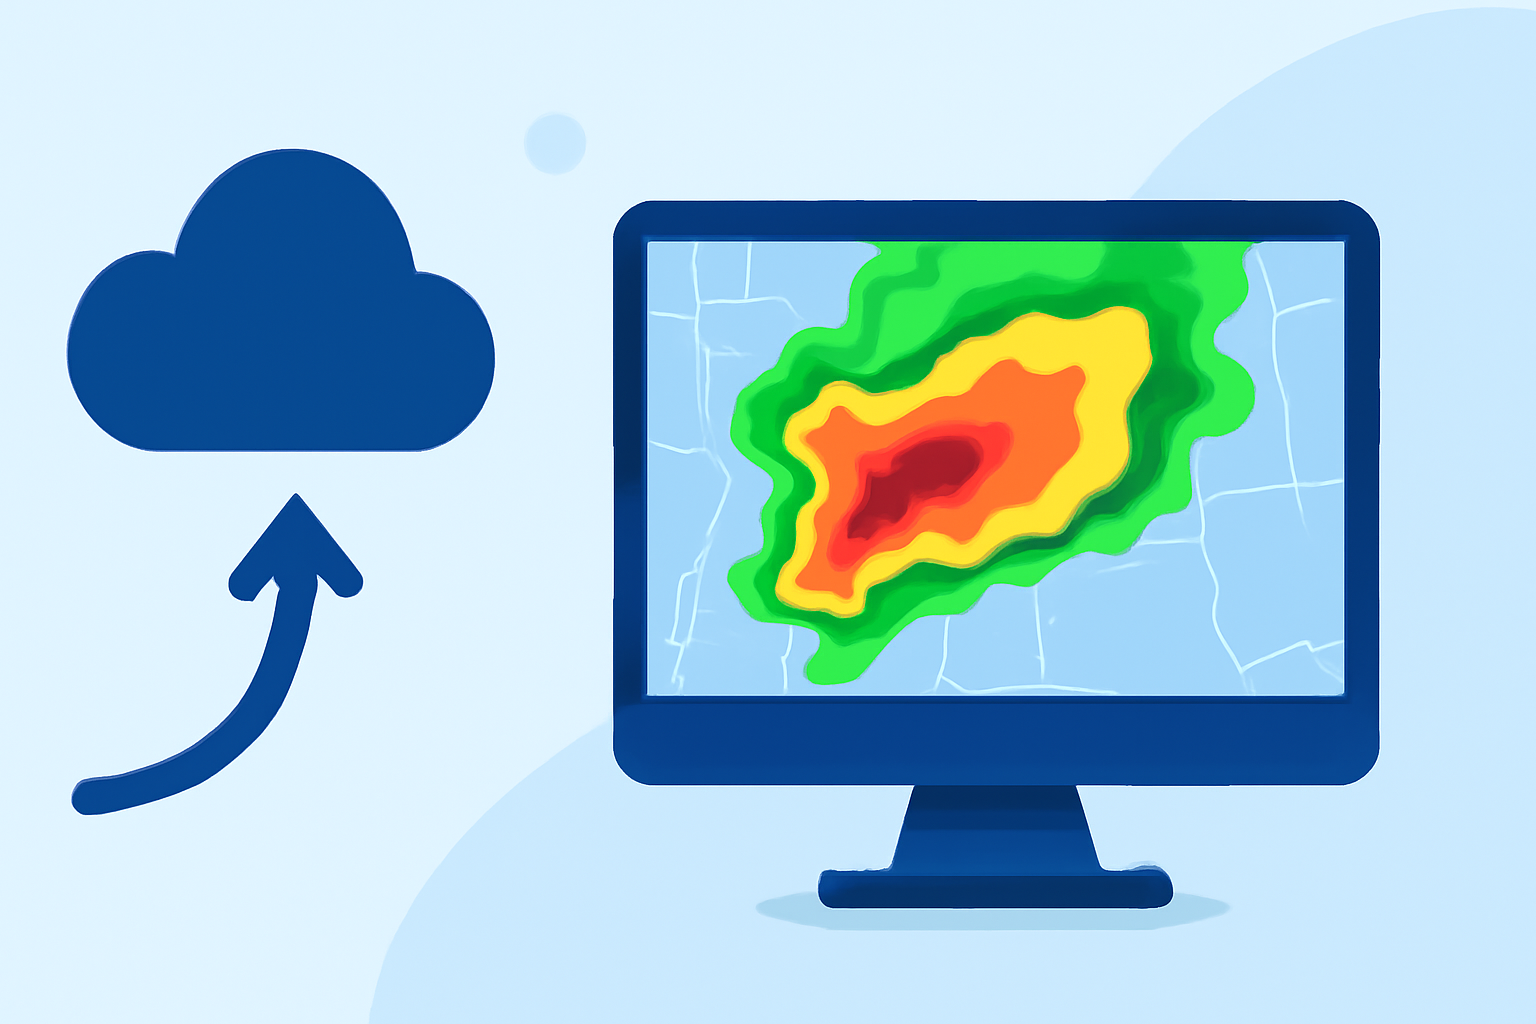
Base reflectivity maps are essential tools for understanding precipitation patterns, crucial for travelers planning their journeys. These maps display the intensity of precipitation by measuring the amount of energy reflected back to a radar from precipitation particles. This information helps in assessing weather conditions and making informed travel decisions.
What Are Base Reflectivity Maps?
Base reflectivity maps are generated by weather radar systems, such as the National Weather Service's NEXRAD (Next-Generation Radar). These maps depict the intensity of precipitation by measuring the energy returned to the radar from precipitation particles like rain, snow, or hail. The reflectivity is expressed in decibels of Z (dBZ), where higher values indicate more intense precipitation. For instance, a value of 20 dBZ typically signifies light rain, while values between 60-65 dBZ may indicate hail or severe weather conditions. (pacioos.hawaii.edu)
How Are Base Reflectivity Maps Created?
Weather radars emit pulses of energy that travel through the atmosphere. When these pulses encounter precipitation particles, they scatter and reflect some of the energy back to the radar. The radar measures this returned energy to determine the intensity of precipitation. Base reflectivity maps are produced by scanning the atmosphere at a low elevation angle, typically around 0.5 degrees above the horizon, providing a snapshot of precipitation near the ground. (weather.gov)
Why Are Base Reflectivity Maps Important for Travelers?
For travelers, base reflectivity maps offer real-time insights into precipitation patterns along their routes. By analyzing these maps, travelers can identify areas experiencing rain, snow, or other forms of precipitation, allowing them to adjust their plans accordingly. This information is particularly valuable for road trips, outdoor activities, or any travel plans where weather conditions are a critical factor.
How to Interpret Base Reflectivity Maps?
Base reflectivity maps use a color scale to represent different levels of precipitation intensity. Understanding this scale is key to interpreting the maps effectively:
-
Light Precipitation (Blue to Green): Indicates light rain or drizzle.
-
Moderate Precipitation (Yellow to Orange): Signifies moderate rain or snow.
-
Heavy Precipitation (Red to Purple): Represents heavy rain, snow, or potential hail.
By recognizing these color codes, travelers can gauge the severity of weather conditions in specific areas. (milplanner.com)
Limitations of Base Reflectivity Maps
While base reflectivity maps are valuable, they have certain limitations:
-
Limited Vertical Information: These maps primarily provide data from the lowest elevation angle, which may not capture precipitation occurring at higher altitudes.
-
Potential for Ground Clutter: Objects like buildings or terrain can cause false returns, leading to inaccuracies in the data.
Travelers should be aware of these limitations and consider consulting additional weather resources for a comprehensive understanding of conditions.
How to Access Base Reflectivity Maps?
Base reflectivity maps are accessible through various platforms, including the National Weather Service's website and other weather services. These platforms offer interactive maps where travelers can view current precipitation patterns, forecasted conditions, and other relevant weather information. Utilizing these resources can aid in planning and ensuring safety during travel.
Conclusion
Base reflectivity maps are indispensable tools for travelers, providing real-time insights into precipitation patterns and helping in making informed decisions. By understanding how to interpret these maps and recognizing their limitations, travelers can enhance their preparedness and safety during their journeys.
Highlights:
- NWS Radar: Information the Radar Can Show Us
- Windy: Weather Radar: The Science Behind the Colorful Images We See Practically Every Day