
Understanding Base Reflectivity Maps for Winter Storms: A Beginner's Guide
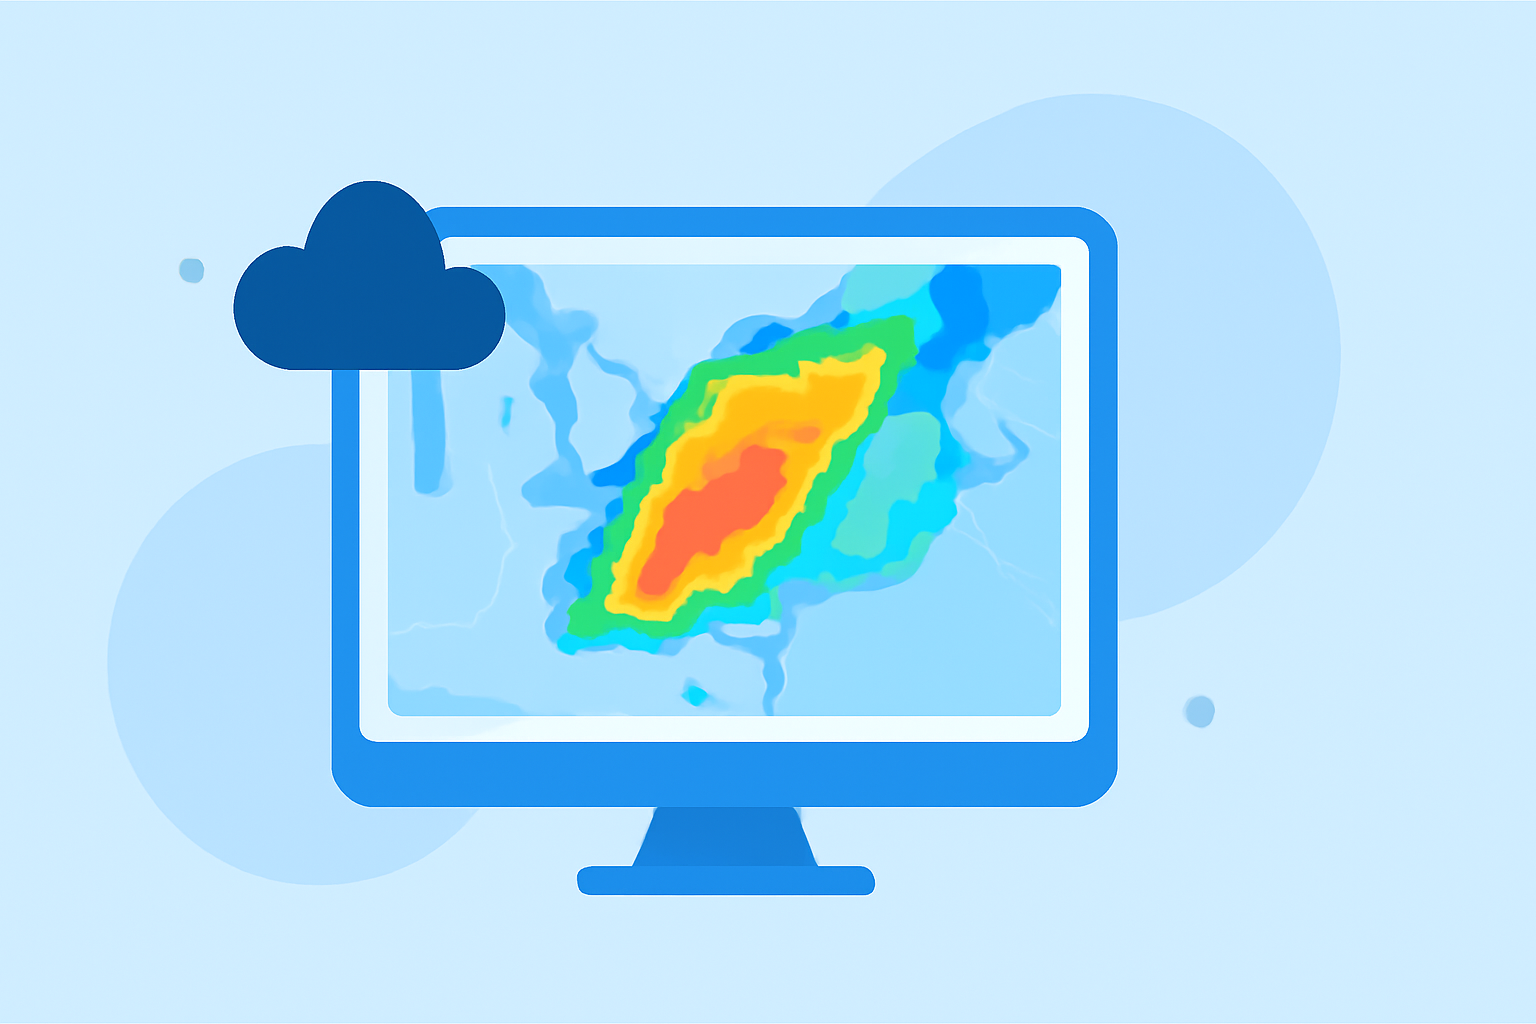
Base reflectivity maps are essential tools for monitoring winter storms, providing real-time insights into precipitation intensity and distribution. These maps display the amount of transmitted power returned to the radar receiver, measured in decibels of Z (dBZ), indicating precipitation intensity. (dixwx.com)
What Are Base Reflectivity Maps?
Base reflectivity maps represent the lowest elevation scan (0.5°) of weather radar data, offering immediate insights into precipitation patterns. They are particularly useful for detecting precipitation, evaluating storm structure, locating atmospheric boundaries, and determining hail potential. (dixwx.com)
How Are Base Reflectivity Maps Used in Winter Storms?
During winter storms, base reflectivity maps help identify precipitation types—such as snow, sleet, or freezing rain—and assess their intensity. By analyzing these maps, meteorologists can predict storm behavior, issue timely warnings, and inform public safety measures.
How to Read Base Reflectivity Maps?
Base reflectivity maps use color gradients to represent varying precipitation intensities:
-
Light Precipitation: Dark green shades indicate light precipitation.
-
Moderate Precipitation: Yellow hues represent moderate precipitation.
-
Heavy Precipitation: Dark red or purple colors signify heavy precipitation.
Understanding these color codes enables users to quickly assess storm severity and potential impact.
Where Can You Access Base Reflectivity Maps?
Base reflectivity maps are available through various platforms, including:
-
National Weather Service (NWS): The NWS provides real-time base reflectivity maps accessible on their website. (prod-01-alb-www-noaa.woc.noaa.gov)
-
Jeppesen's NEXRAD Radar Maps: Jeppesen offers NEXRAD radar maps with base reflectivity, including winter radar mosaics that depict precipitation types and intensities. (jsumsweb.jeppesen.com)
-
Mesonet's National Radar: Mesonet provides a composite of all radars across the United States, displaying base reflectivity maps. (mesonet.org)
How Does Clime Enhance Your Winter Storm Monitoring?
Clime offers advanced weather monitoring tools that integrate base reflectivity data, providing users with real-time insights into winter storm developments. By leveraging Clime's platform, users can access comprehensive weather information, including precipitation types and intensities, to make informed decisions during winter storms.
Conclusion
Base reflectivity maps are invaluable for understanding and monitoring winter storms. By interpreting these maps, individuals can gain critical insights into storm behavior, aiding in preparedness and safety measures. Utilizing platforms like Clime can further enhance the monitoring experience, offering real-time data and comprehensive weather information.