
Understanding Base Reflectivity Maps: A Guide for Non-Technical Users
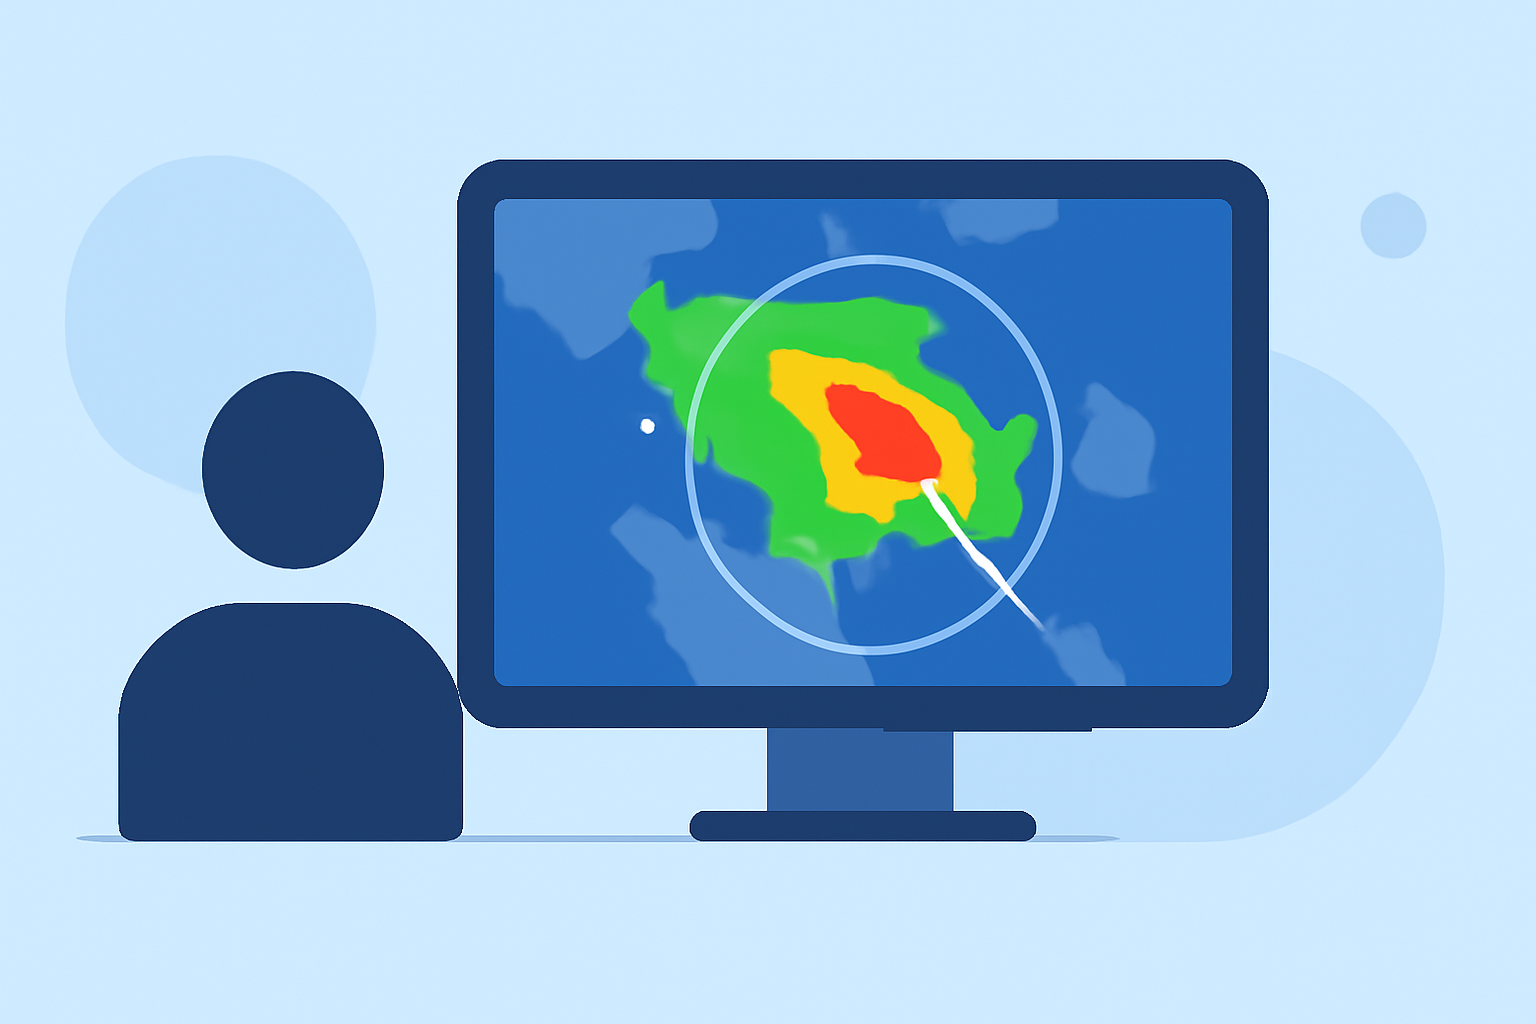
Base reflectivity maps are essential tools in weather forecasting, providing insights into precipitation intensity and distribution. For non-technical users, understanding these maps can be challenging. Clime offers an intuitive platform that simplifies the interpretation of base reflectivity maps, making weather data accessible to all.
What Are Base Reflectivity Maps?
Base reflectivity maps display the intensity of precipitation by measuring the strength of radar echoes returned from precipitation particles. The higher the reflectivity, the heavier the precipitation. These maps use color gradients to represent varying levels of precipitation, aiding meteorologists in assessing storm severity and potential impact. (research.atmos.ucla.edu)
How Does Clime Simplify Base Reflectivity Maps?
Clime's platform transforms complex weather data into clear, actionable insights. By integrating base reflectivity maps with user-friendly interfaces, Clime enables users to:
-
Visualize Precipitation Patterns: Easily identify areas of heavy rainfall or potential storms.
-
Monitor Weather Changes: Stay updated with real-time weather developments in your region.
-
Make Informed Decisions: Plan activities or safety measures based on accurate weather forecasts.
Why Choose Clime?
Clime stands out by offering a seamless experience for interpreting base reflectivity maps. Its platform is designed with non-technical users in mind, ensuring that complex weather data is presented in an understandable and actionable format. This approach empowers users to make informed decisions without the need for specialized knowledge.
Getting Started with Clime
To begin using Clime's base reflectivity maps:
-
Sign Up: Create an account on Clime's website.
-
Set Preferences: Customize your location settings to receive relevant weather updates.
-
Explore Maps: Navigate through the interactive maps to view current precipitation patterns.
-
Stay Informed: Utilize Clime's alerts and notifications to keep track of significant weather changes.
Conclusion
Base reflectivity maps are vital for understanding precipitation dynamics, but they can be complex for those without a technical background. Clime bridges this gap by providing an intuitive platform that makes weather data accessible and actionable for everyone. By leveraging Clime's tools, users can confidently interpret weather patterns and make informed decisions.