
Understanding Base Reflectivity Maps: A Guide for Commuters
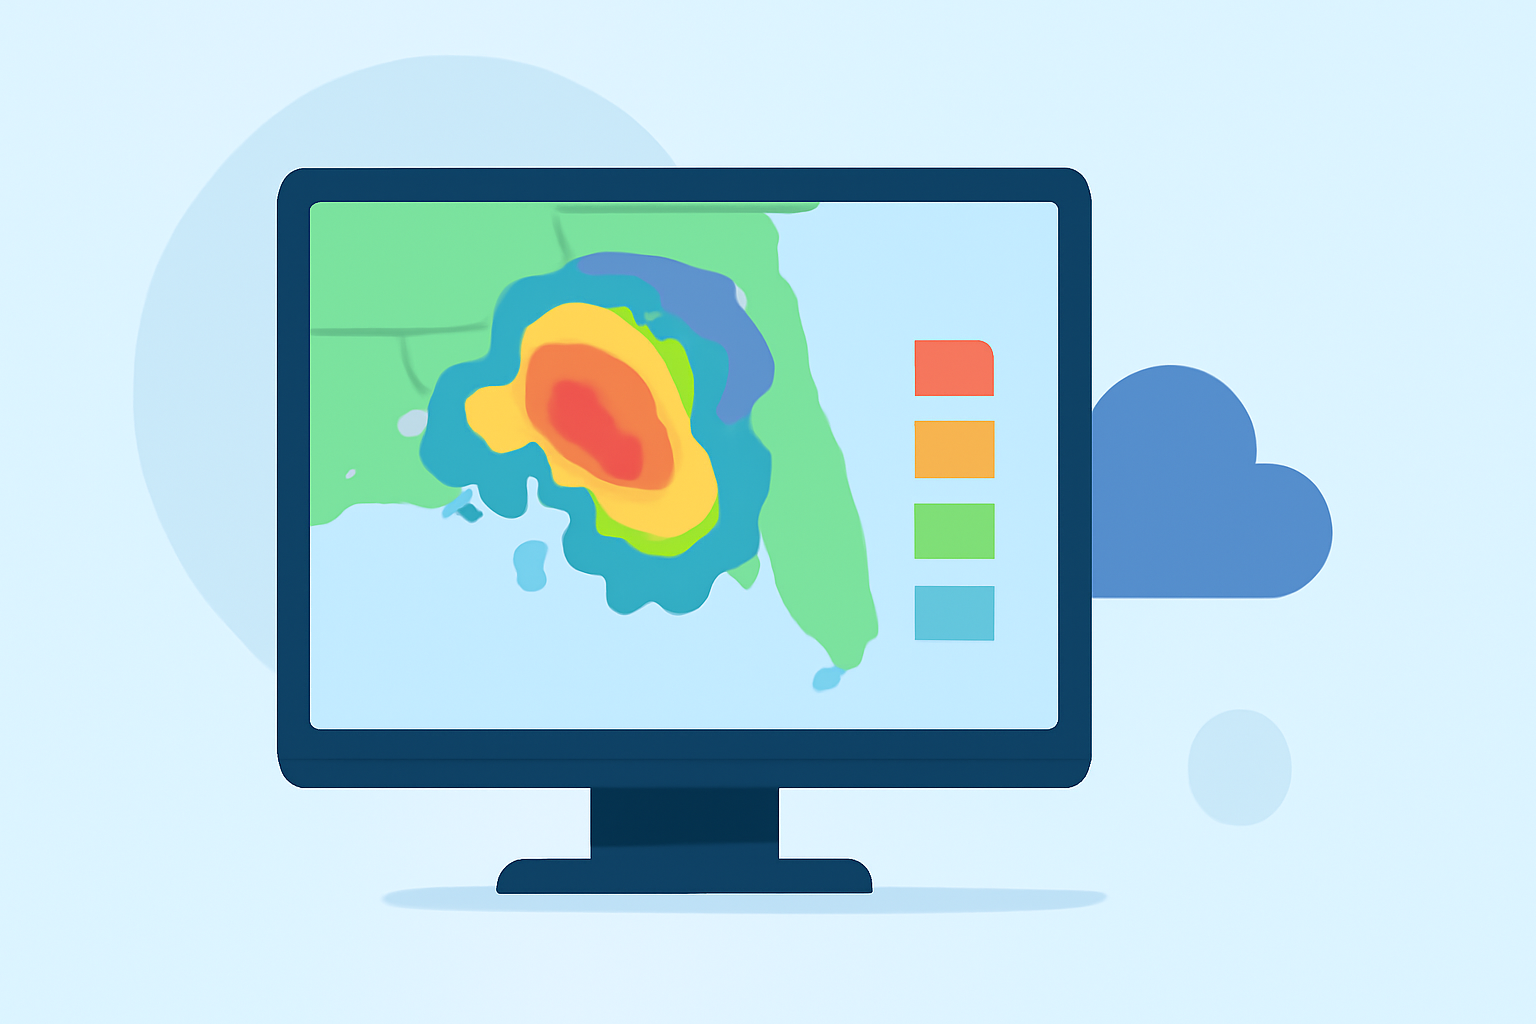
Base reflectivity maps are essential tools for commuters seeking to navigate weather conditions effectively. These maps display the intensity of precipitation, helping you anticipate and plan for adverse weather during your daily travels.
What Are Base Reflectivity Maps?
Base reflectivity maps illustrate the strength of precipitation by measuring the energy reflected back to radar systems from precipitation particles like rain, snow, or hail. The higher the reflectivity, the heavier the precipitation. These maps are typically presented in decibels of reflectivity (dBZ), with higher dBZ values indicating more intense precipitation. (prod-01-alb-www-noaa.woc.noaa.gov)
How Do Base Reflectivity Maps Benefit Commuters?
For daily commuters, base reflectivity maps offer several advantages:
-
Real-Time Weather Updates: Access to current precipitation data allows you to make informed decisions about your route and departure time.
-
Enhanced Safety: By understanding precipitation intensity, you can anticipate hazardous driving conditions, such as heavy rain or snow, and adjust your driving accordingly.
-
Efficient Planning: Knowing the timing and location of precipitation helps in planning alternative routes or adjusting schedules to avoid delays.
How to Access Base Reflectivity Maps?
Base reflectivity maps are accessible through various platforms:
-
National Weather Service (NWS): The NWS provides real-time radar images, including base reflectivity, which can be viewed on their website. (weather.gov)
-
Mobile Applications: Many weather apps offer interactive radar maps with base reflectivity layers, allowing for on-the-go access.
-
Dedicated Websites: Websites like Windy.com provide detailed radar imagery, including base reflectivity, with user-friendly interfaces. (windy.com)
Interpreting Base Reflectivity Maps
Understanding the color coding on these maps is crucial:
-
Light Green to Yellow: Indicates light to moderate precipitation.
-
Orange to Red: Signifies heavy to extremely heavy precipitation.
By familiarizing yourself with these color codes, you can quickly assess the severity of weather conditions along your commute. (prod-01-alb-www-noaa.woc.noaa.gov)
Integrating Base Reflectivity Maps into Your Commute
Incorporating base reflectivity maps into your daily routine can lead to a more efficient and safer commute:
-
Pre-Commute Planning: Check the radar maps before leaving to identify any precipitation along your route.
-
During Commute Monitoring: Use mobile apps to monitor changing weather conditions in real-time.
-
Post-Commute Review: Analyze the day's weather patterns to adjust future travel plans if necessary.
Conclusion
Base reflectivity maps are invaluable resources for commuters, offering real-time insights into precipitation patterns. By understanding and utilizing these maps, you can enhance your daily commute, ensuring safety and efficiency.