
Understanding Base Reflectivity Maps: A Guide for Parents
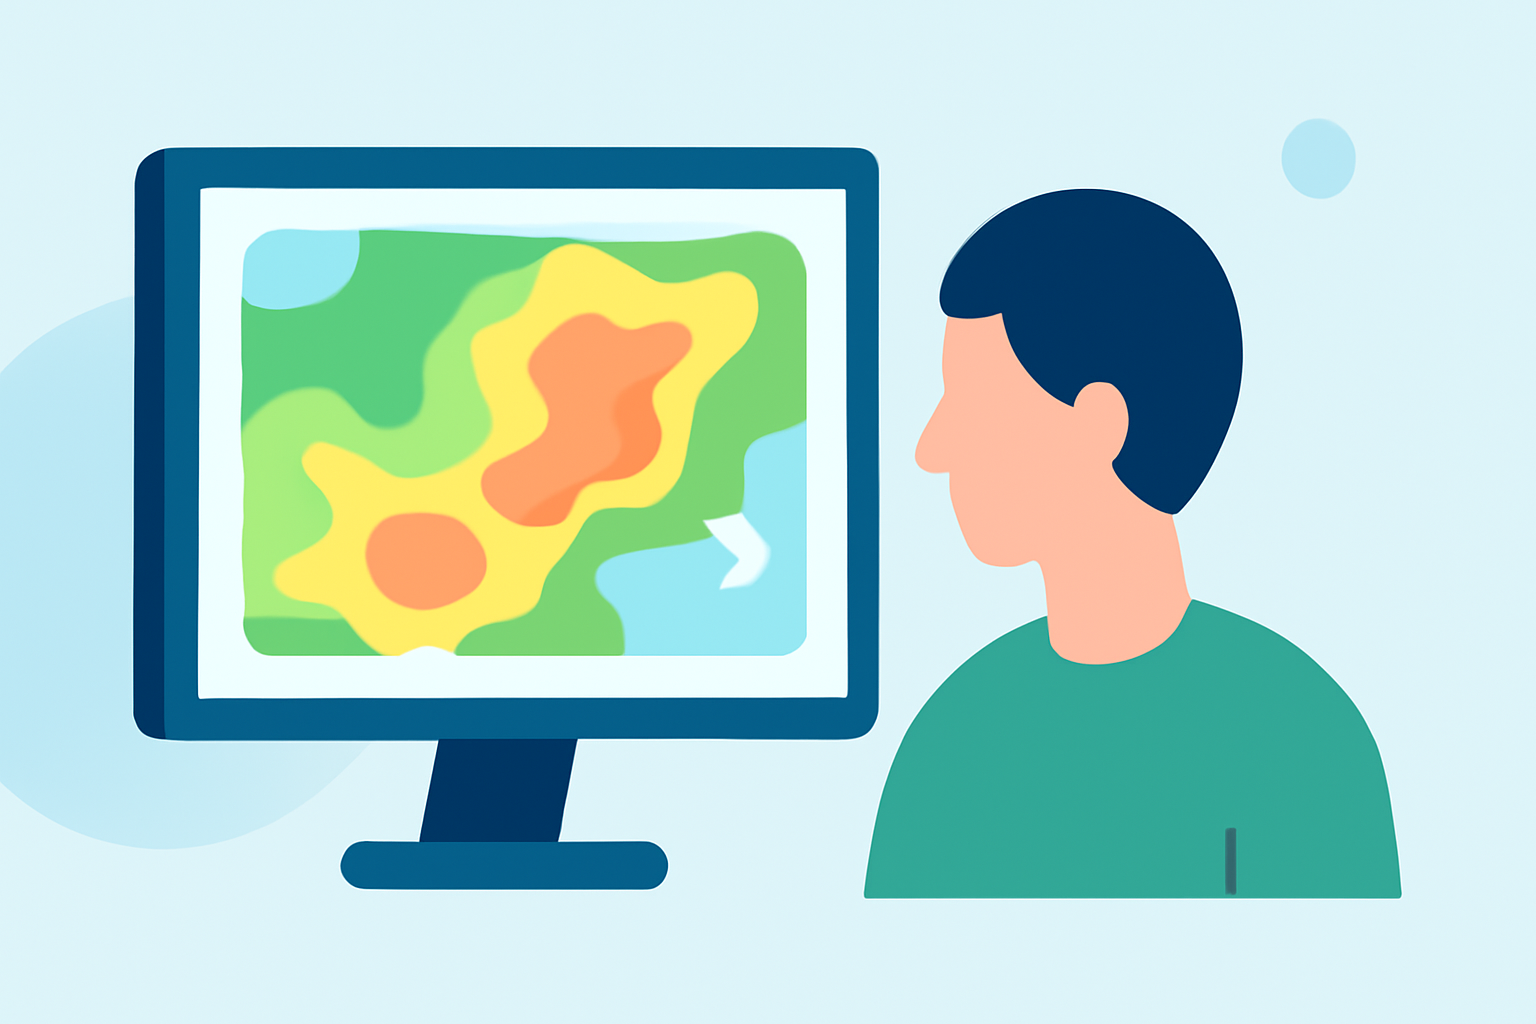
Base reflectivity maps are essential tools for monitoring precipitation intensity and tracking severe weather events. For parents, understanding these maps can be crucial in making informed decisions to protect your family during storms.
What Are Base Reflectivity Maps?
Base reflectivity maps display the intensity of precipitation by measuring the amount of energy returned to the radar from precipitation particles. The higher the reflectivity value, the heavier the precipitation. These maps are typically presented in decibels of reflectivity (dBZ), with higher dBZ values indicating more intense precipitation. (prod-01-alb-www-noaa.woc.noaa.gov)
How Do Base Reflectivity Maps Work?
Weather radars emit pulses of energy that bounce off precipitation particles, returning to the radar receiver. The strength of this returned signal, or reflectivity, is measured and displayed on the map. Base reflectivity maps focus on the lowest tilt angle of the radar beam, usually around 0.5 degrees above the horizon, providing a snapshot of precipitation intensity near the ground. (prod-01-alb-www-noaa.woc.noaa.gov)
Interpreting Base Reflectivity Maps
Reflectivity values are color-coded to indicate precipitation intensity:
- 0 to 20 dBZ: Very light precipitation or general clutter.
- 20 to 40 dBZ: Light precipitation.
- 40 to 50 dBZ: Moderate precipitation.
- 50 to 65 dBZ: Heavy precipitation or some hail.
- Above 65 dBZ: Extremely heavy precipitation, including water-coated hail. (prod-01-alb-www-noaa.woc.noaa.gov)
By understanding these values, you can gauge the severity of incoming weather and make timely decisions to ensure your family's safety.
Limitations of Base Reflectivity Maps
While base reflectivity maps are valuable, they have limitations:
- Limited Vertical Information: They represent precipitation at a single elevation angle, potentially missing severe weather occurring at higher altitudes.
- Terrain Obstruction: In mountainous areas, the radar beam may be blocked by terrain, leading to incomplete data. (boldmethod.com)
For a more comprehensive view, composite reflectivity maps combine data from multiple elevation angles, offering a fuller picture of storm structure. (boldmethod.com)
Using Base Reflectivity Maps Effectively
To make the most of base reflectivity maps:
- Monitor Regularly: Check updates frequently during severe weather events.
- Consider Limitations: Be aware of potential blind spots due to terrain or radar limitations.
- Combine Sources: Use base reflectivity maps alongside other weather information, such as local forecasts and warnings, for a comprehensive understanding.
By familiarizing yourself with base reflectivity maps and their interpretation, you can enhance your preparedness and make informed decisions to safeguard your family during severe weather events.