
Understanding Base Reflectivity Maps on Tablets: A Comprehensive Guide
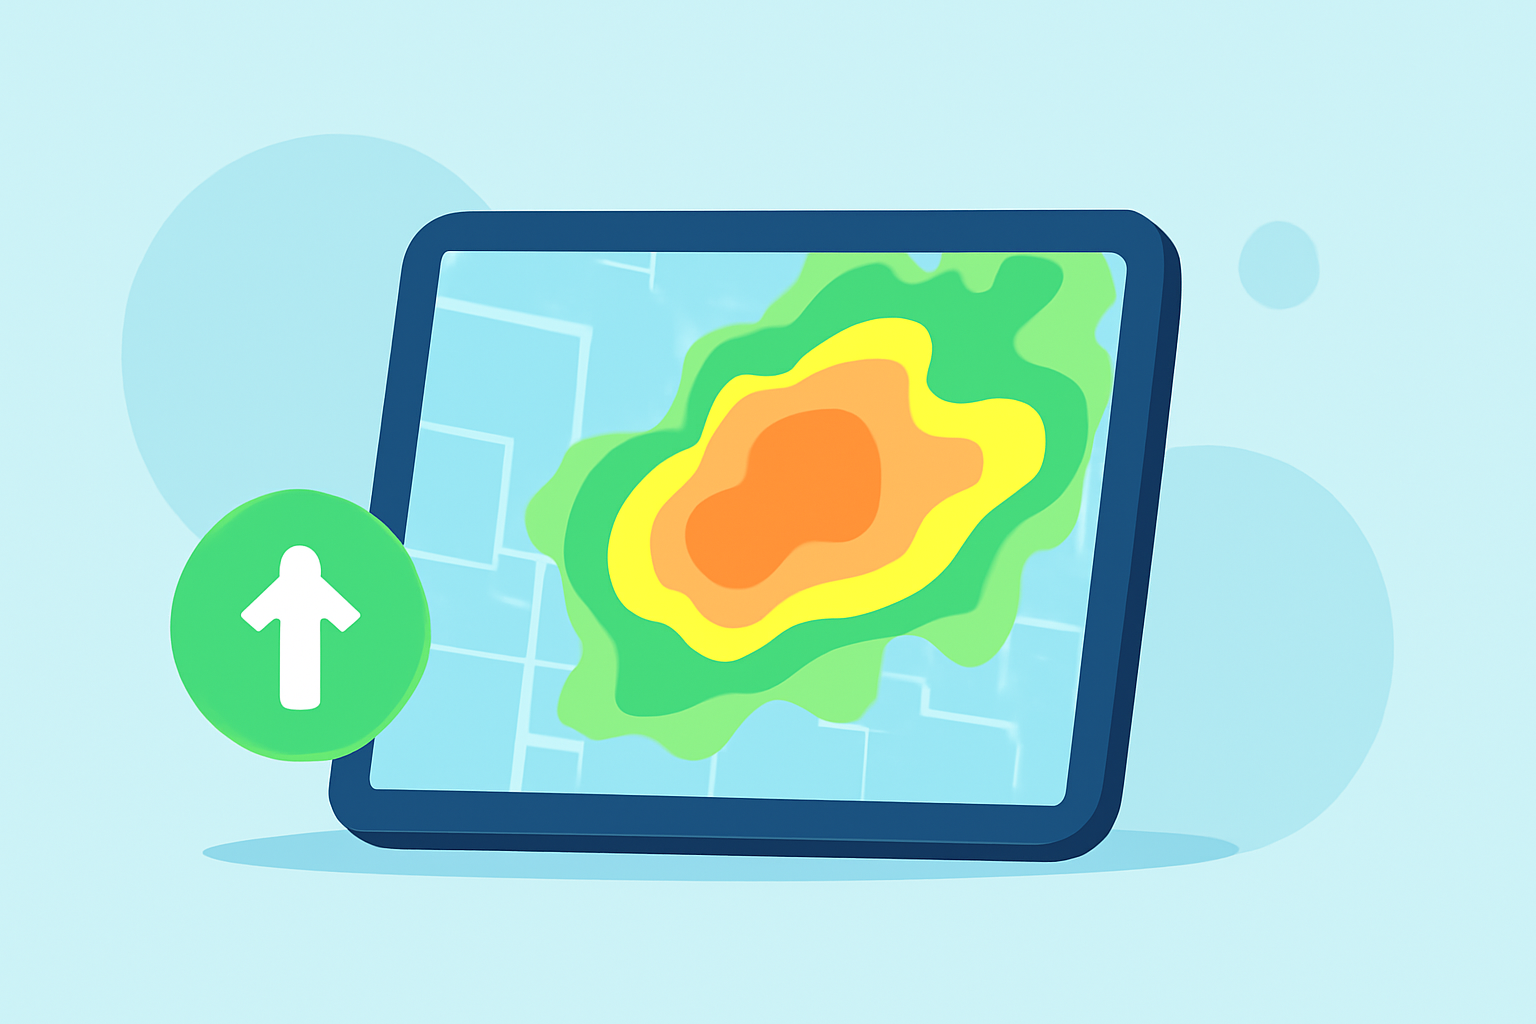
Base reflectivity maps are essential tools for analyzing precipitation intensity and storm structures. Accessing these maps on a tablet offers convenience and real-time data, enhancing your ability to monitor weather patterns effectively.
What Are Base Reflectivity Maps?
Base reflectivity maps display the intensity of precipitation by measuring the amount of energy reflected back to the radar from precipitation particles. This data is presented in decibels of reflectivity (dBZ), with higher values indicating heavier precipitation. These maps are crucial for identifying storm structures, monitoring severe weather, and assessing rainfall rates. (okfirst.mesonet.org)
How Do Base Reflectivity Maps Work?
Weather radars emit signals that scatter off precipitation particles, returning to the radar receiver. The strength of this returned signal, or reflectivity, is measured and displayed on the map. Colors on the map correspond to different reflectivity values, aiding in the identification of precipitation intensity and storm severity. (research.atmos.ucla.edu)
Accessing Base Reflectivity Maps on a Tablet
To view base reflectivity maps on your tablet, consider the following options:
-
Weather Applications: Many weather apps provide radar imagery, including base reflectivity maps. Ensure the app offers real-time updates and covers your region of interest.
-
Online Platforms: Websites like ClimateViewer offer interactive maps displaying NEXRAD radar data, including base reflectivity. These platforms are accessible via tablet browsers and provide detailed, up-to-date information. (climateviewer.org)
Interpreting Base Reflectivity Maps
When analyzing base reflectivity maps, keep the following in mind:
-
Color Interpretation: Colors represent different reflectivity values, with darker colors indicating lighter precipitation and lighter colors indicating heavier precipitation.
-
Storm Structure: Base reflectivity maps help identify storm features such as hook echoes, which can indicate tornado potential, and hail cores, which suggest severe weather conditions. (okfirst.mesonet.org)
-
Limitations: Base reflectivity maps represent the lowest volume scan angle from the radar, typically around 0.5 degrees. This means they may not capture precipitation occurring at higher altitudes, potentially missing severe weather events. (research.atmos.ucla.edu)
Enhancing Your Weather Monitoring with Base Reflectivity Maps
Utilizing base reflectivity maps on your tablet can significantly improve your weather monitoring capabilities:
-
Real-Time Updates: Accessing these maps provides timely information, allowing for prompt responses to changing weather conditions.
-
Detailed Analysis: The ability to zoom in on specific areas enables a more thorough understanding of local weather patterns.
-
Preparation: Accurate weather data aids in planning and preparedness, reducing the impact of severe weather events.
By effectively utilizing base reflectivity maps on your tablet, you can enhance your understanding of weather patterns, leading to better preparedness and safety.
Highlights:
- NEXRAD Radar Maps
- Interpretation Guide: BASE REFLECTIVITY
- Weather Radar Fundamentals