
Understanding Base Reflectivity Maps on Tablets: A Comprehensive Guide
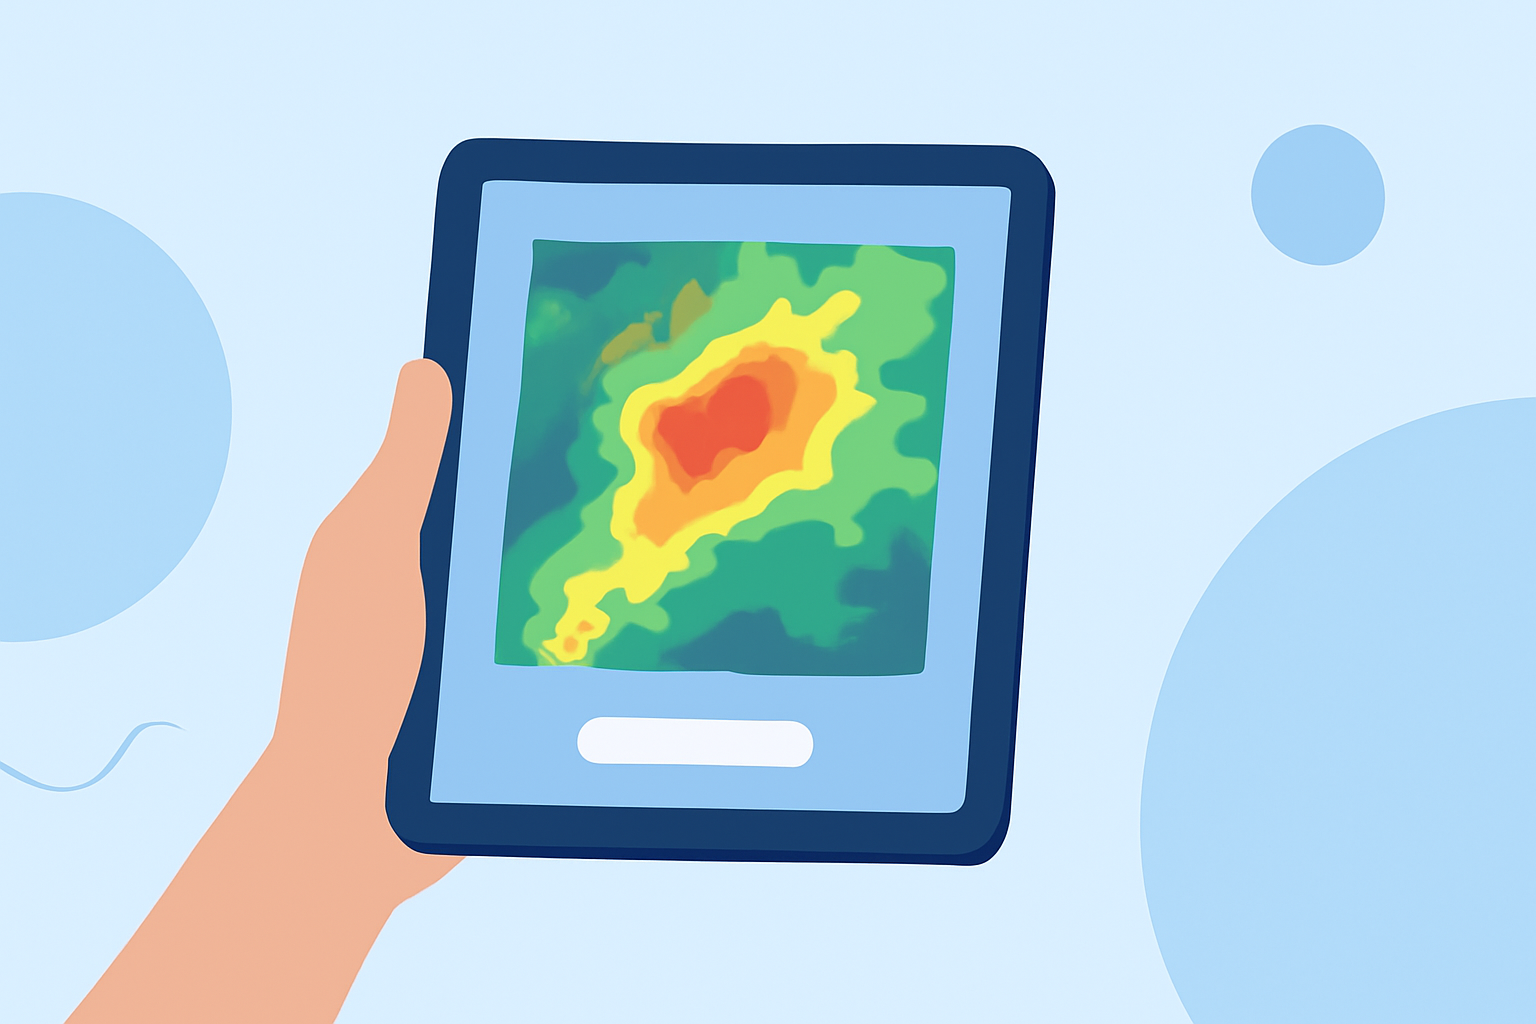
Base reflectivity maps are essential tools for meteorologists and weather enthusiasts, providing real-time data on precipitation intensity and distribution. Accessing these maps on a tablet offers the convenience of on-the-go weather analysis. This guide explores the fundamentals of base reflectivity maps and how to utilize them effectively on your tablet.
What Are Base Reflectivity Maps?
Base reflectivity maps display the intensity of precipitation by measuring the strength of radar echoes returned from precipitation particles. The higher the reflectivity value, the heavier the precipitation. These maps are color-coded to indicate varying levels of precipitation intensity, aiding in the identification of weather patterns such as rain, snow, sleet, and hail. (research.atmos.ucla.edu)
How Do Base Reflectivity Maps Work?
Weather radars emit radio waves that bounce off precipitation particles in the atmosphere. The returned signal's strength, or reflectivity, is measured in decibels (dBZ). Higher dBZ values correspond to larger or more numerous precipitation particles, indicating heavier precipitation. For instance, a dBZ value of 50 suggests heavy rainfall, while a value of 60 indicates intense thunderstorms with potential hail. (windy.com)
Accessing Base Reflectivity Maps on Tablets
To view base reflectivity maps on your tablet, consider the following options:
-
Weather Applications: Many weather apps offer interactive radar features, including base reflectivity maps. Ensure the app provides real-time data and is compatible with your tablet's operating system.
-
Online Platforms: Websites like ClimateViewer offer interactive maps displaying NEXRAD radar data, including base reflectivity. These platforms are accessible through your tablet's web browser. (climateviewer.org)
-
Specialized Software: Some software solutions provide detailed radar data and may offer tablet compatibility. Check the software's specifications to ensure it meets your needs.
Interpreting Base Reflectivity Maps
Understanding the color scale is crucial for accurate interpretation:
-
Light Green (10-20 dBZ): Very light rain or light snow.
-
Dark Green (20-30 dBZ): Light to moderate rain or moderate snow.
-
Yellow (30-40 dBZ): Moderate to heavy rain or sleet showers.
-
Orange (40-50 dBZ): Heavy rain or intense sleet showers.
-
Red (50-60 dBZ): Severe thunderstorms with potential hail.
-
Pink (60+ dBZ): Extreme precipitation, often associated with severe weather events. (radarscope.com.au)
Best Practices for Using Base Reflectivity Maps on Tablets
-
Regular Updates: Ensure your app or software provides real-time data to stay informed about current weather conditions.
-
Zoom Functionality: Utilize zoom features to focus on specific areas of interest, enhancing the map's detail and accuracy.
-
Layer Integration: Combine base reflectivity maps with other weather data layers, such as velocity or echo tops, for a comprehensive analysis.
-
Offline Access: Some applications allow downloading maps for offline use, which is beneficial in areas with limited connectivity.
Conclusion
Base reflectivity maps are invaluable tools for understanding precipitation patterns and forecasting weather events. Accessing these maps on a tablet provides flexibility and convenience, allowing for timely and informed decisions. By selecting the right application and understanding how to interpret the data, you can enhance your weather analysis capabilities.